 6
6peptides
spectra
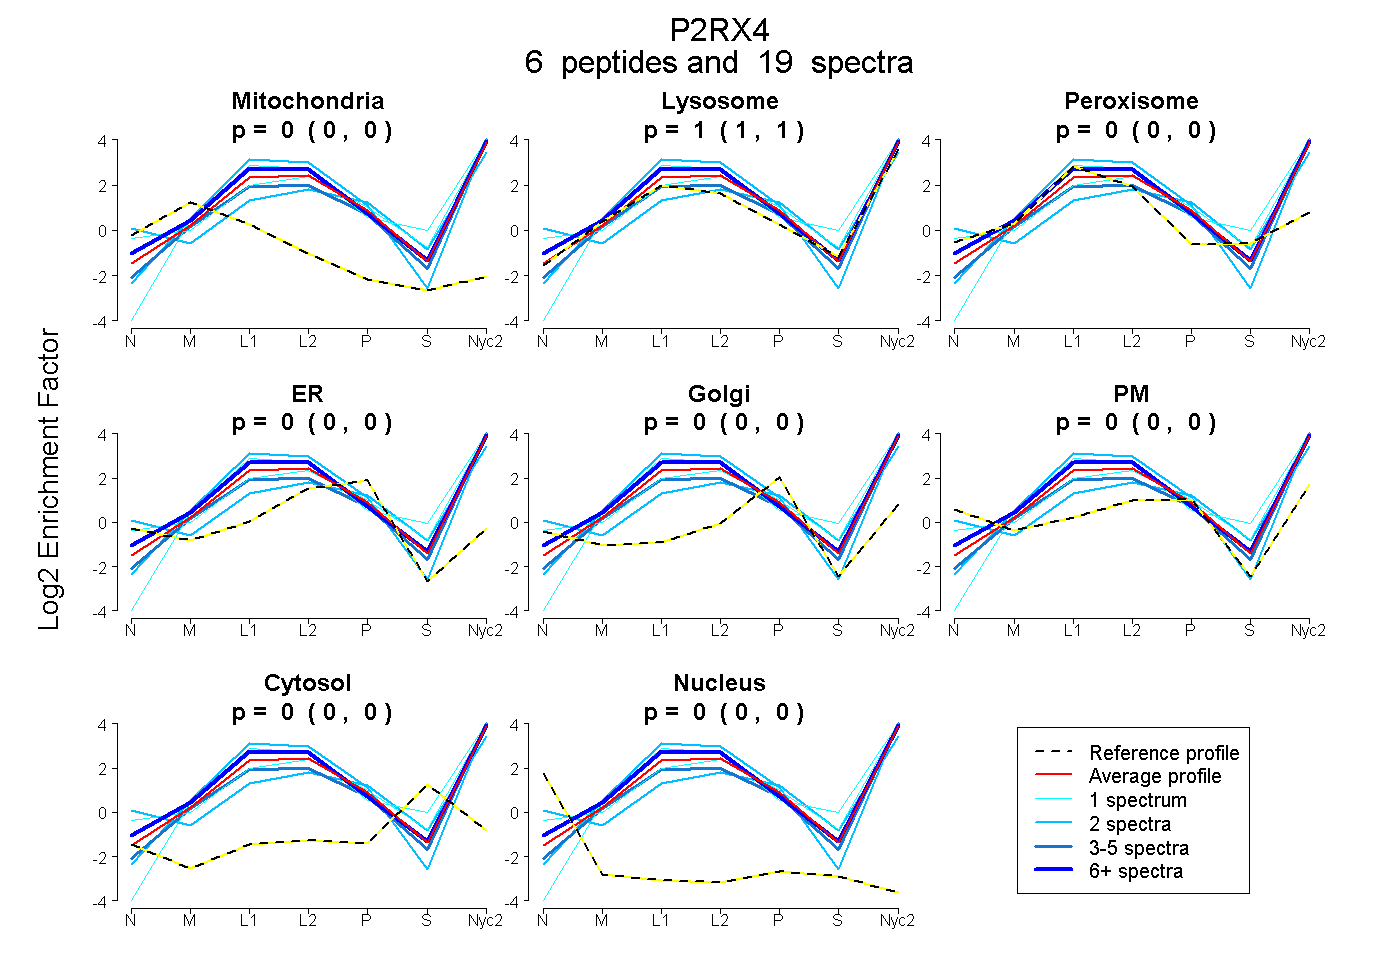
0.000 | 0.000
0.997 | 1.000
0.000 | 0.000
0.000 | 0.001
0.000 | 0.000
0.000 | 0.000
0.000 | 0.000
0.000 | 0.000
3peptides
spectra
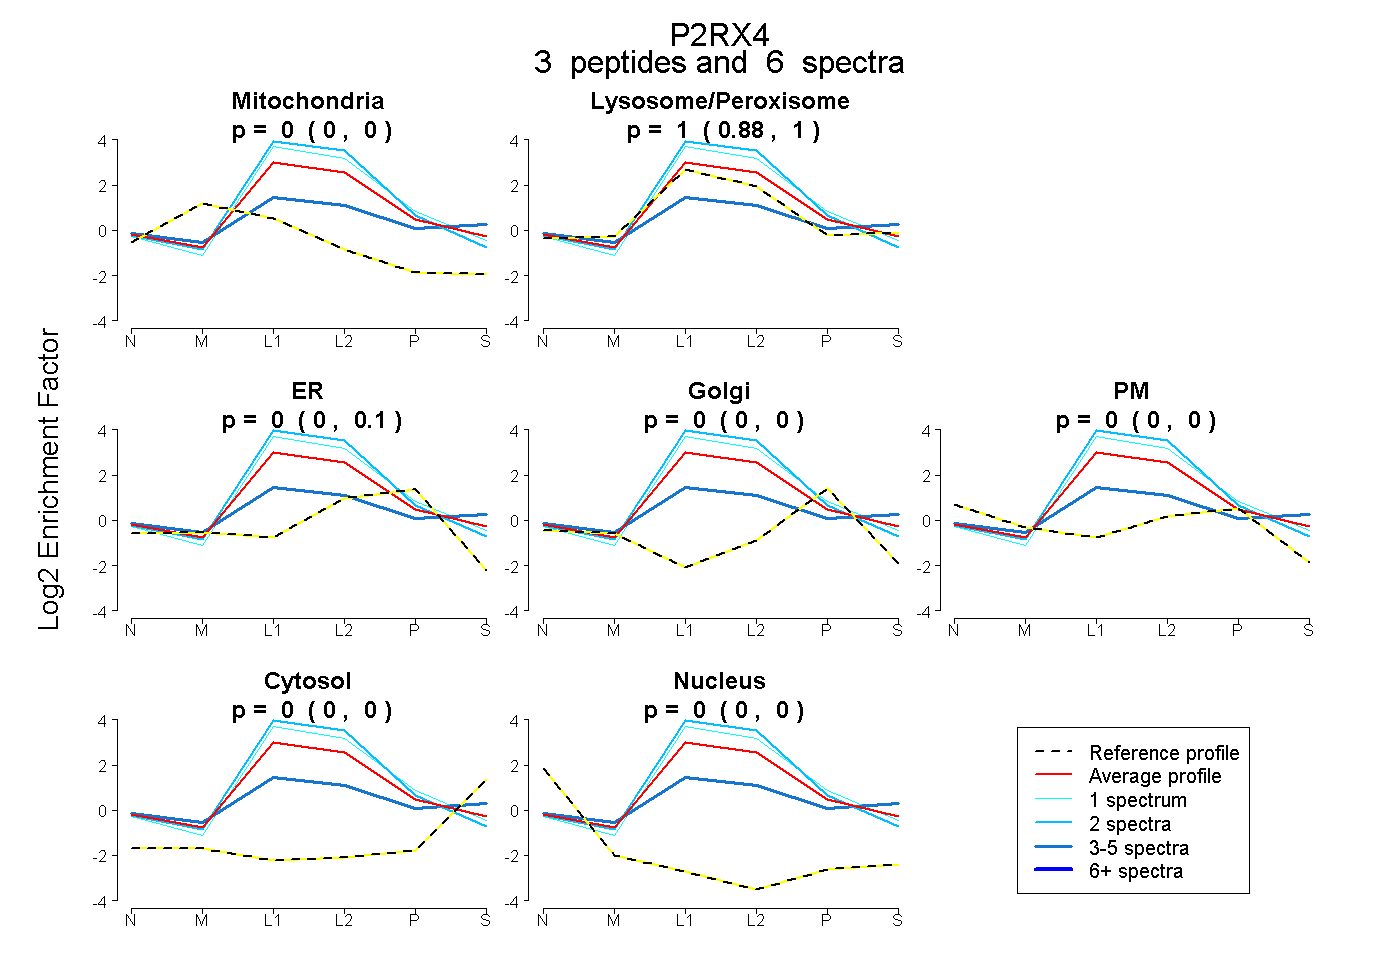
0.000 | 0.000
0.883 | 1.000
0.000 | 0.097
0.000 | 0.000
0.000 | 0.000
0.000 | 0.000
0.000 | 0.000
8peptides
spectra
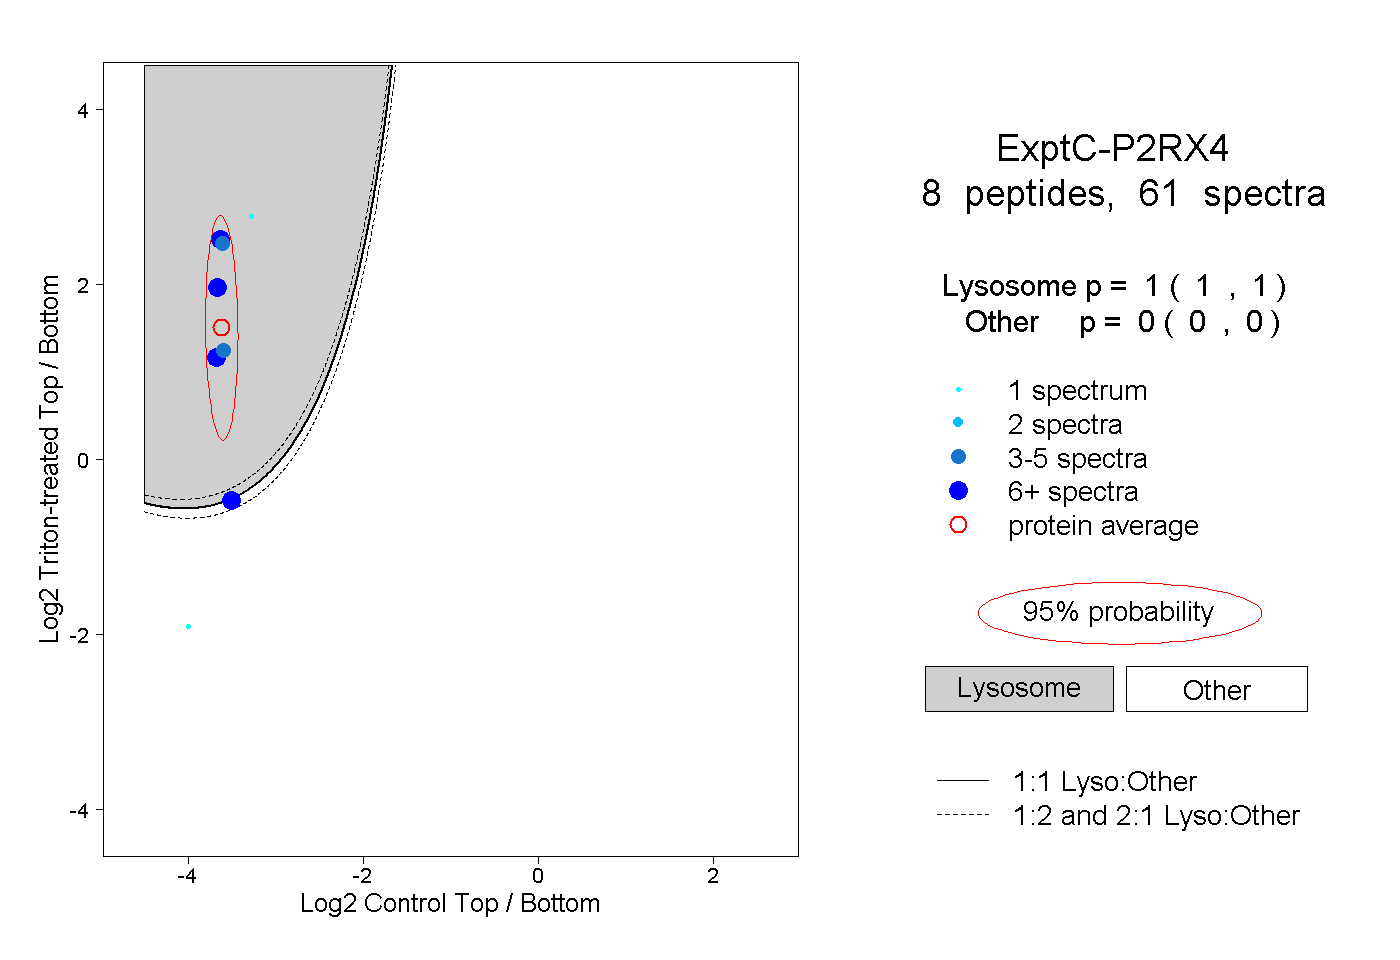
1.000 | 1.000
0.000 | 0.000