 6
6peptides
spectra
0.000 | 0.000
0.997 | 1.000
0.000 | 0.000
0.000 | 0.001
0.000 | 0.000
0.000 | 0.000
0.000 | 0.000
0.000 | 0.000
| Plot | Mito | Lyso | Perox | ER | Golgi | PM | Cytosol | Nucleus | |||||
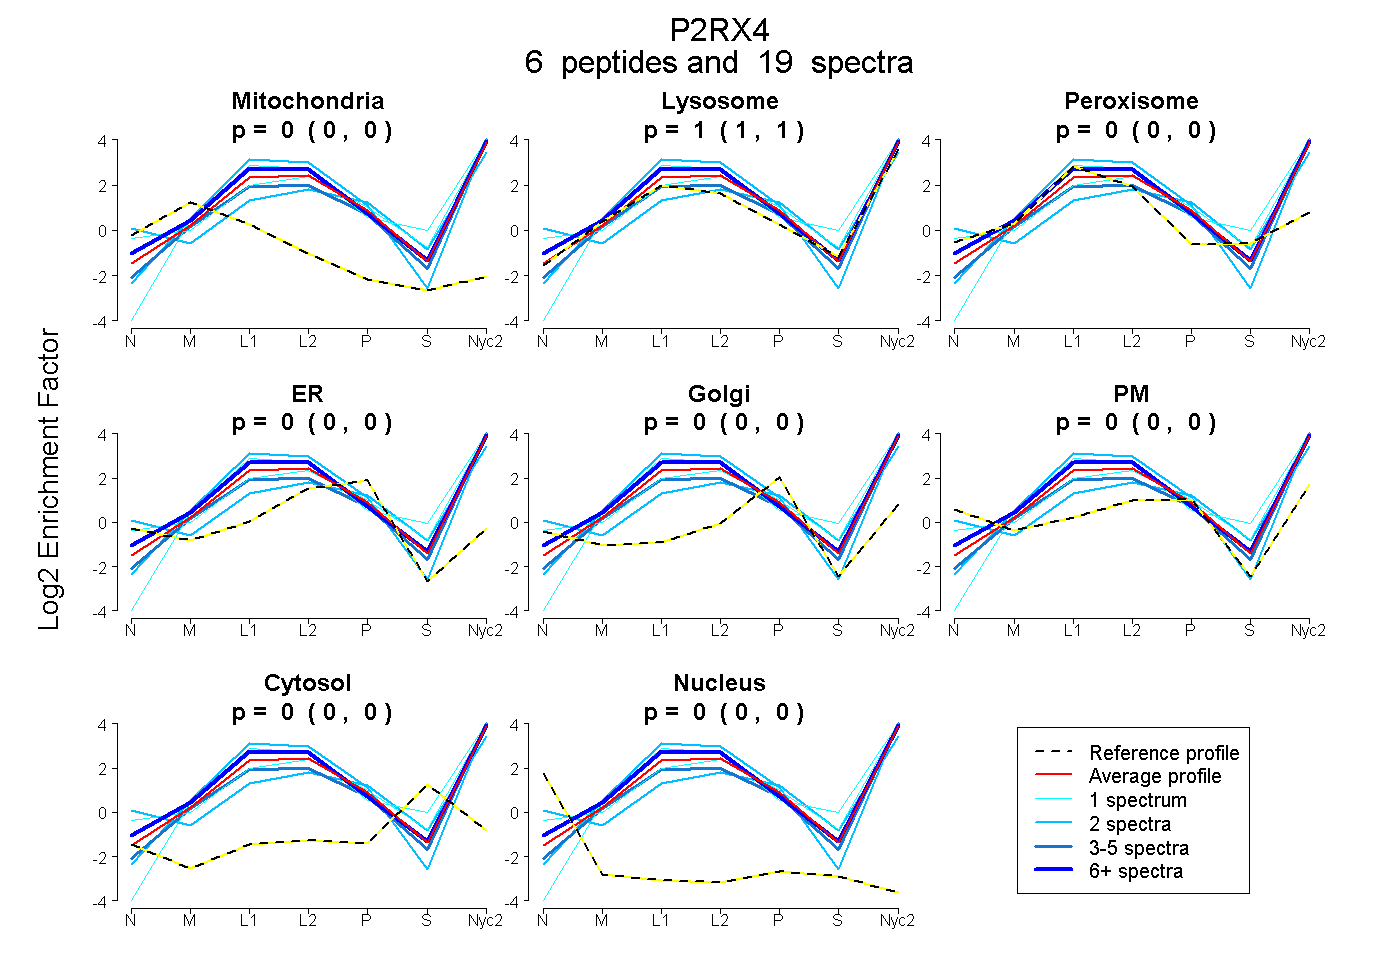
| Expt A |
6 peptides |
19 spectra |
|
0.000 0.000 | 0.000 |
1.000 0.997 | 1.000 |
0.000 0.000 | 0.000 |
0.000 0.000 | 0.001 |
0.000 0.000 | 0.000 |
0.000 0.000 | 0.000 |
0.000 0.000 | 0.000 |
0.000 0.000 | 0.000 |
| 1 spectrum, NNIWYPK | 0.000 | 0.893 | 0.000 | 0.000 | 0.000 | 0.107 | 0.000 | 0.000 | ||
| 1 spectrum, VGLMNR | 0.000 | 1.000 | 0.000 | 0.000 | 0.000 | 0.000 | 0.000 | 0.000 | ||
| 2 spectra, AASLCLPR | 0.000 | 1.000 | 0.000 | 0.000 | 0.000 | 0.000 | 0.000 | 0.000 | ||
| 2 spectra, DLEHNVSPGYNFR | 0.000 | 0.593 | 0.000 | 0.000 | 0.000 | 0.407 | 0.000 | 0.000 | ||
| 4 spectra, FDIIVFGK | 0.000 | 1.000 | 0.000 | 0.000 | 0.000 | 0.000 | 0.000 | 0.000 | ||
| 9 spectra, WDCNLDR | 0.000 | 1.000 | 0.000 | 0.000 | 0.000 | 0.000 | 0.000 | 0.000 |
| Plot | Mito | Lyso or Perox | ER | Golgi | PM | Cytosol | Nucleus | ||||||
| Expt B |
3 peptides |
6 spectra |
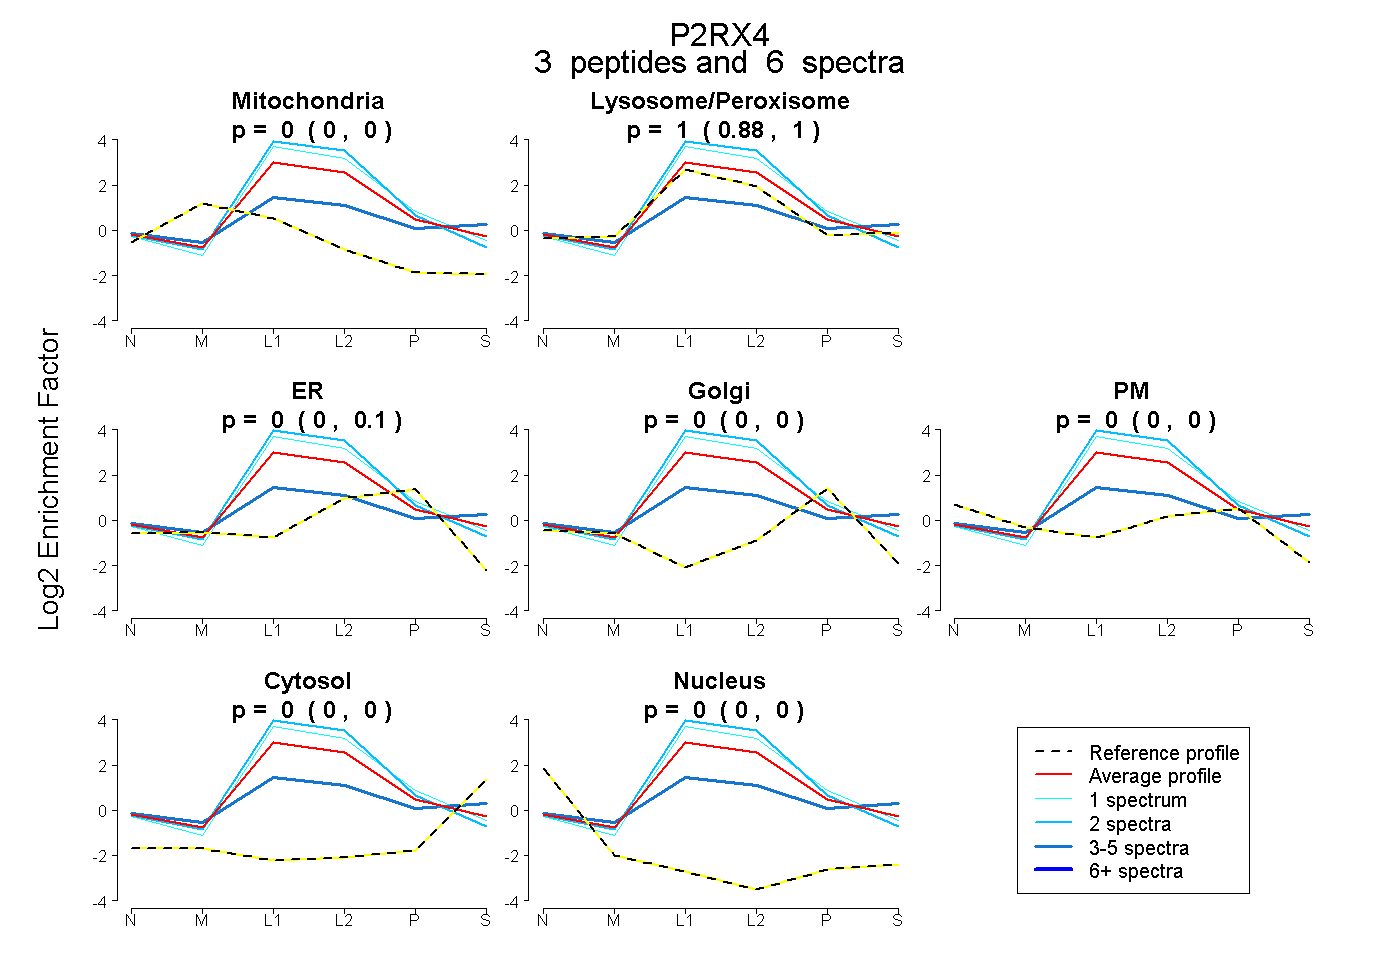 |
0.000 0.000 | 0.000 |
1.000 0.883 | 1.000 |
0.000 0.000 | 0.097 |
0.000 0.000 | 0.000 |
0.000 0.000 | 0.000 |
0.000 0.000 | 0.000 |
0.000 0.000 | 0.000 |
|||
| Plot | Lyso | Other | |||||||||||
| Expt C |
8 peptides |
61 spectra |
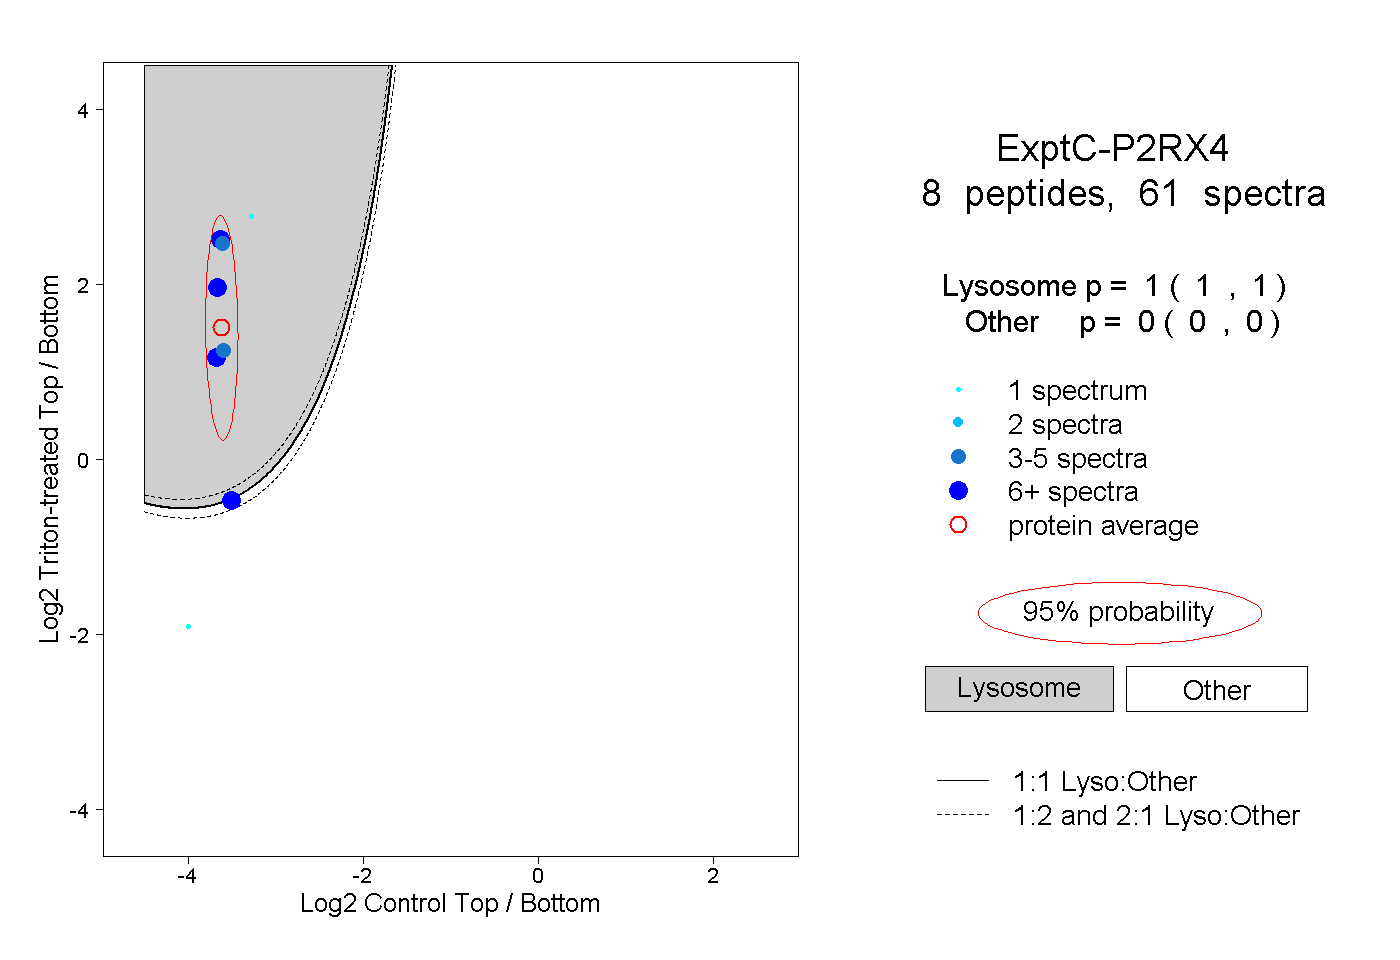 |
1.000 1.000 | 1.000 |
0.000 0.000 | 0.000 |