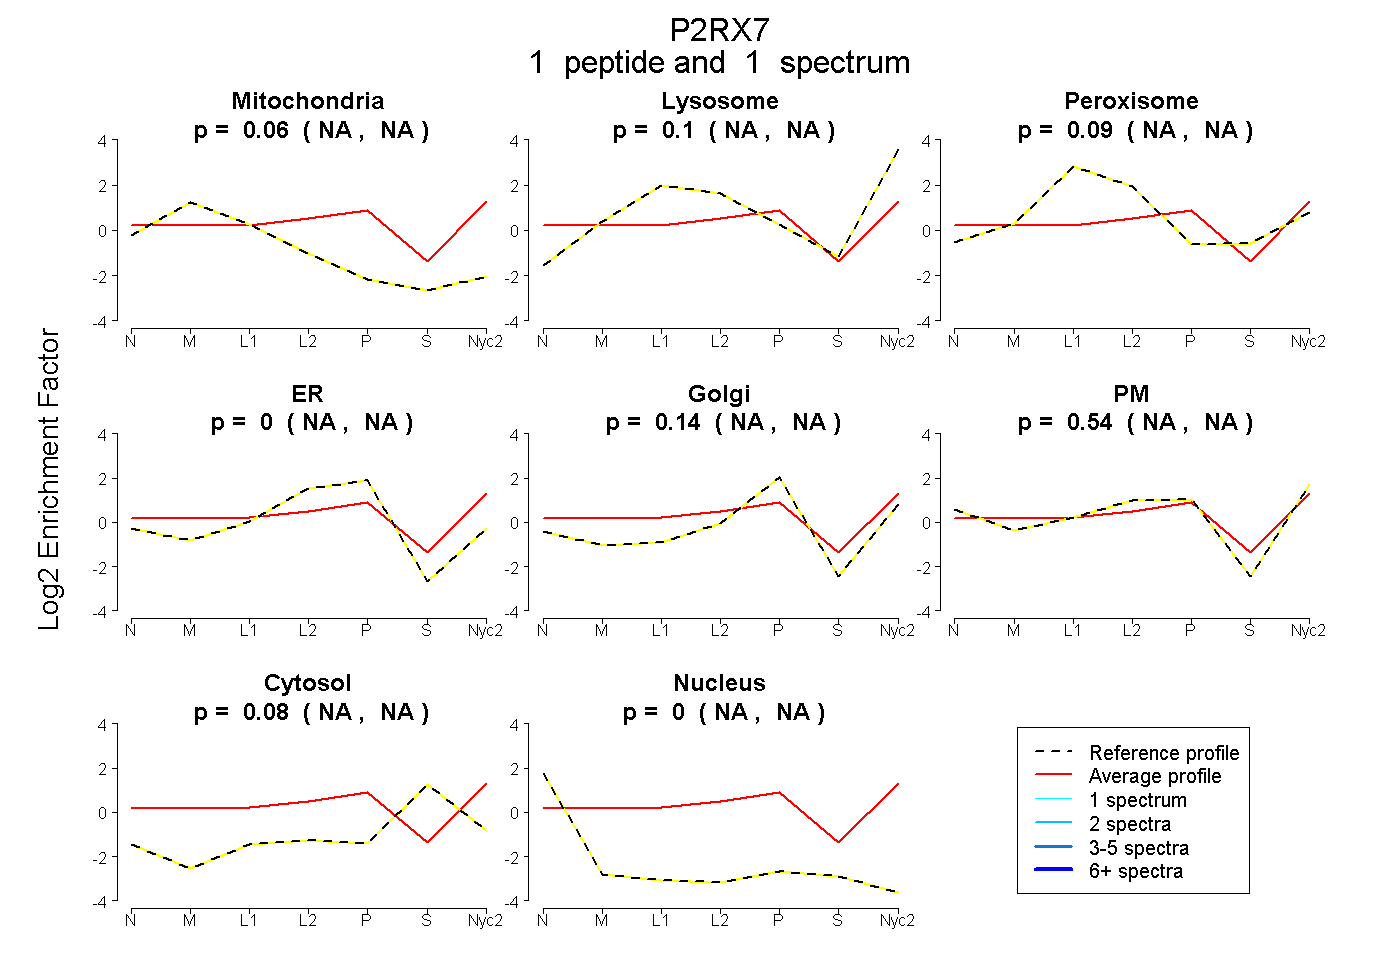
 1
1peptide
spectrum
NA | NA
NA | NA
NA | NA
NA | NA
NA | NA
NA | NA
NA | NA
NA | NA
| Plot | Mito | Lyso | Perox | ER | Golgi | PM | Cytosol | Nucleus | |||||
| Expt A |
1 peptide |
1 spectrum |
|
0.056 NA | NA |
0.099 NA | NA |
0.091 NA | NA |
0.000 NA | NA |
0.135 NA | NA |
0.543 NA | NA |
0.076 NA | NA |
0.000 NA | NA |
| 1 spectrum, GQEVPRPQTDFLELSR | 0.056 | 0.099 | 0.091 | 0.000 | 0.135 | 0.543 | 0.076 | 0.000 |
| Plot | Lyso | Other | |||||||||||
| Expt C |
3 peptides |
4 spectra |
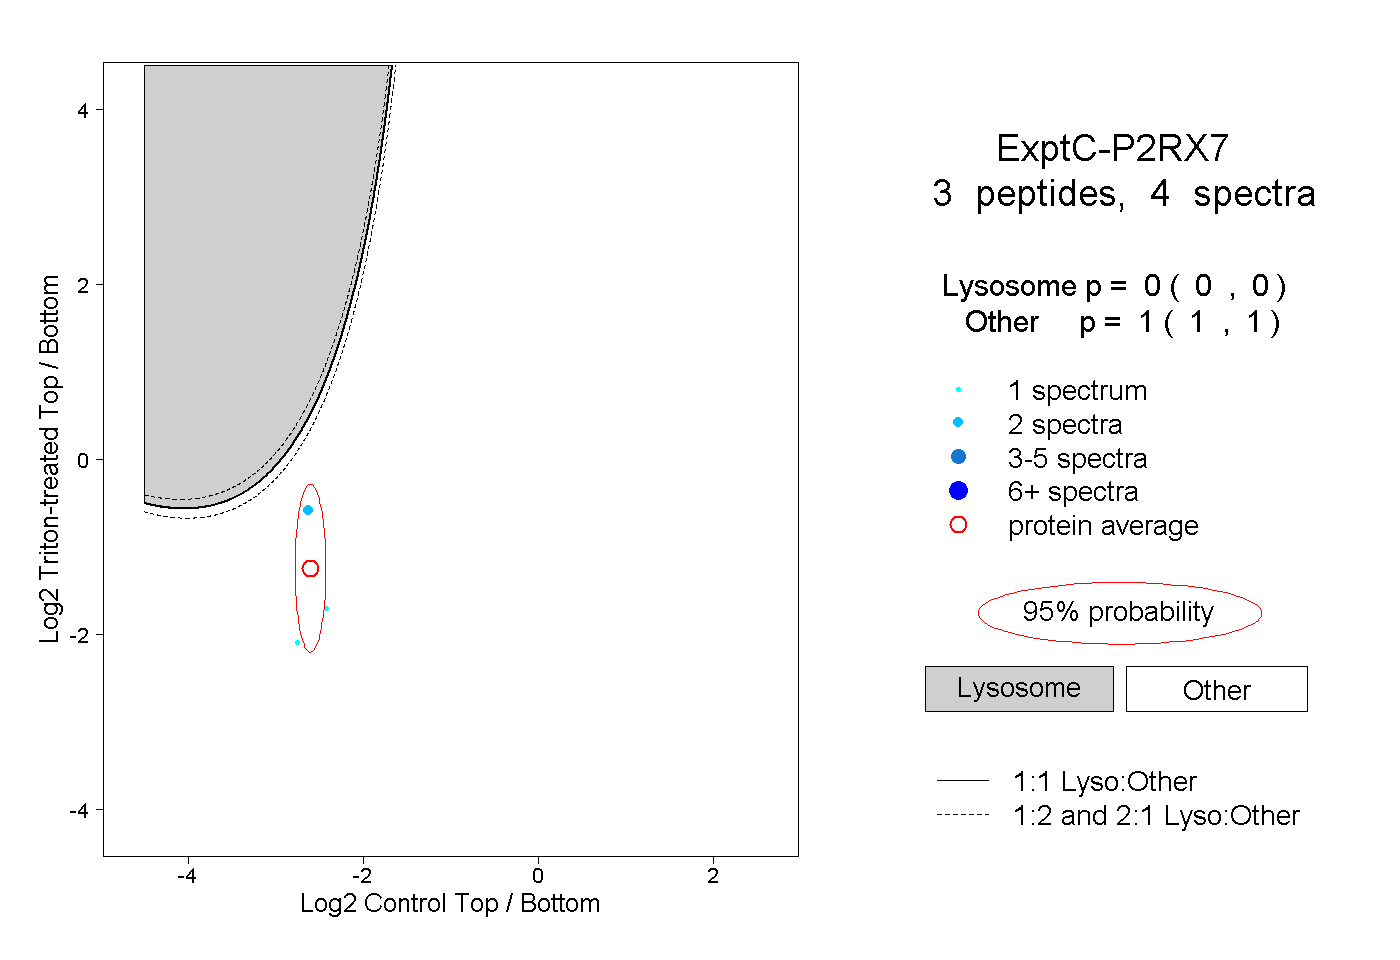 |
0.000 0.000 | 0.000 |
1.000 1.000 | 1.000 |