 2
2peptides
spectra
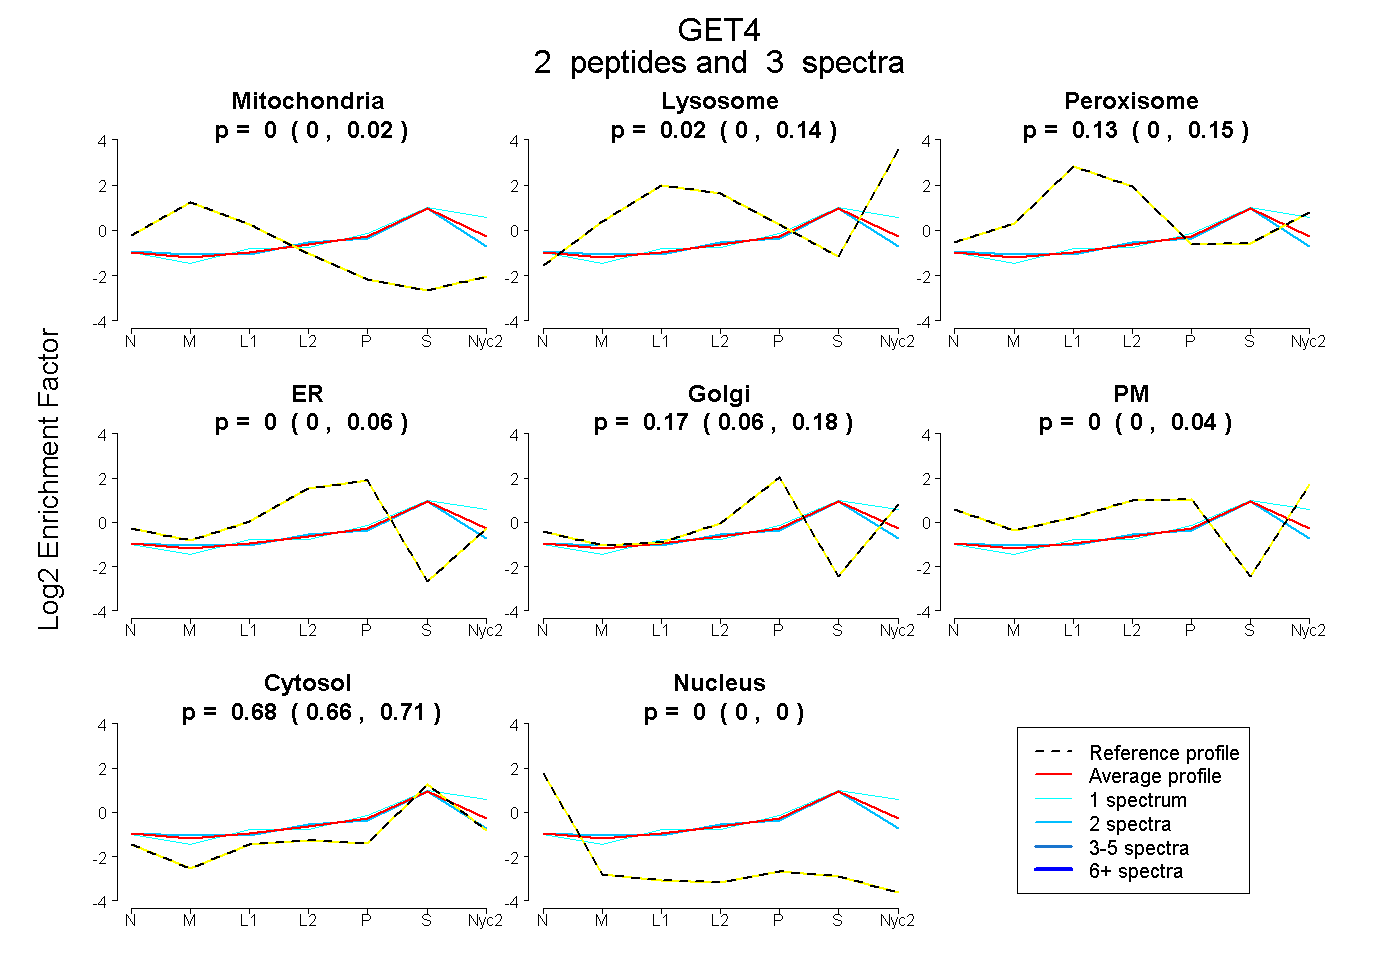
0.000 | 0.020
0.000 | 0.145
0.000 | 0.154
0.000 | 0.058
0.064 | 0.182
0.000 | 0.040
0.664 | 0.705
0.000 | 0.000
1peptide
spectra
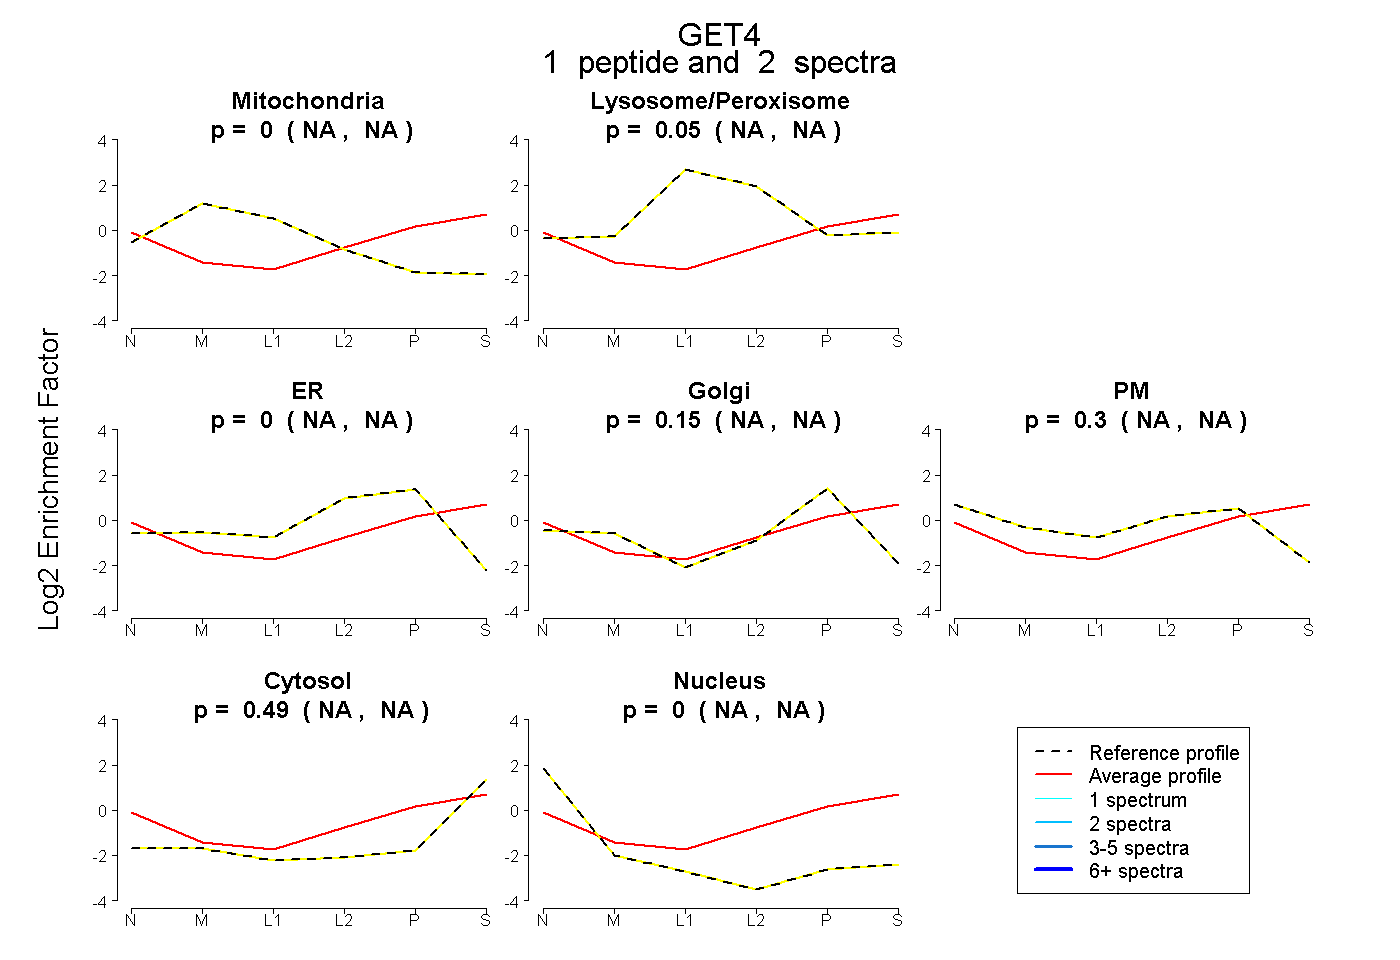
NA | NA
NA | NA
NA | NA
NA | NA
NA | NA
NA | NA
NA | NA
2peptides
spectra
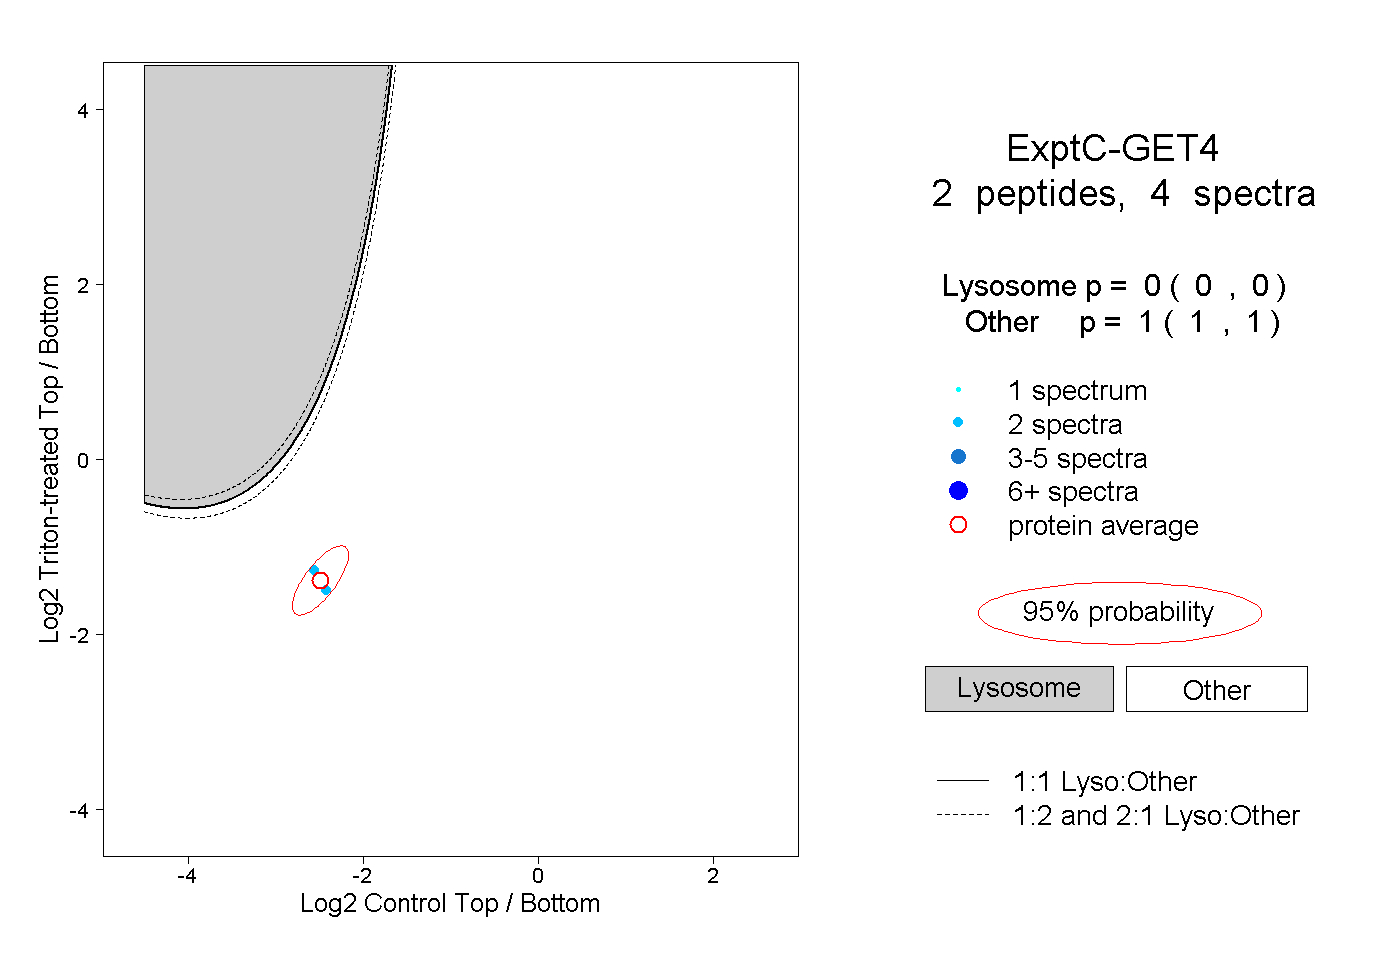
0.000 | 0.000
1.000 | 1.000