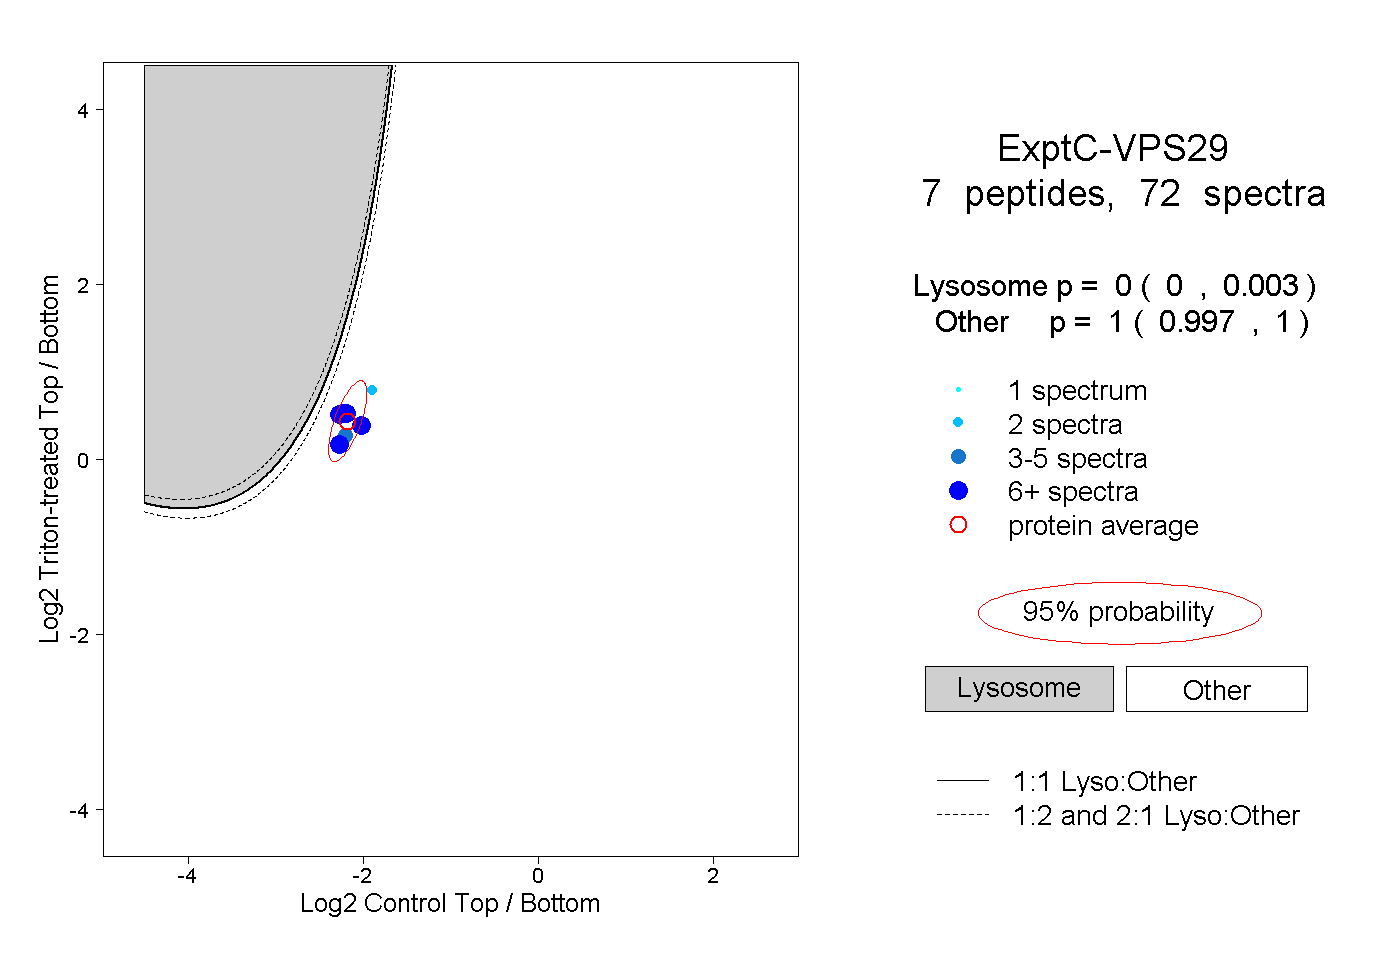
7
7peptides
spectra
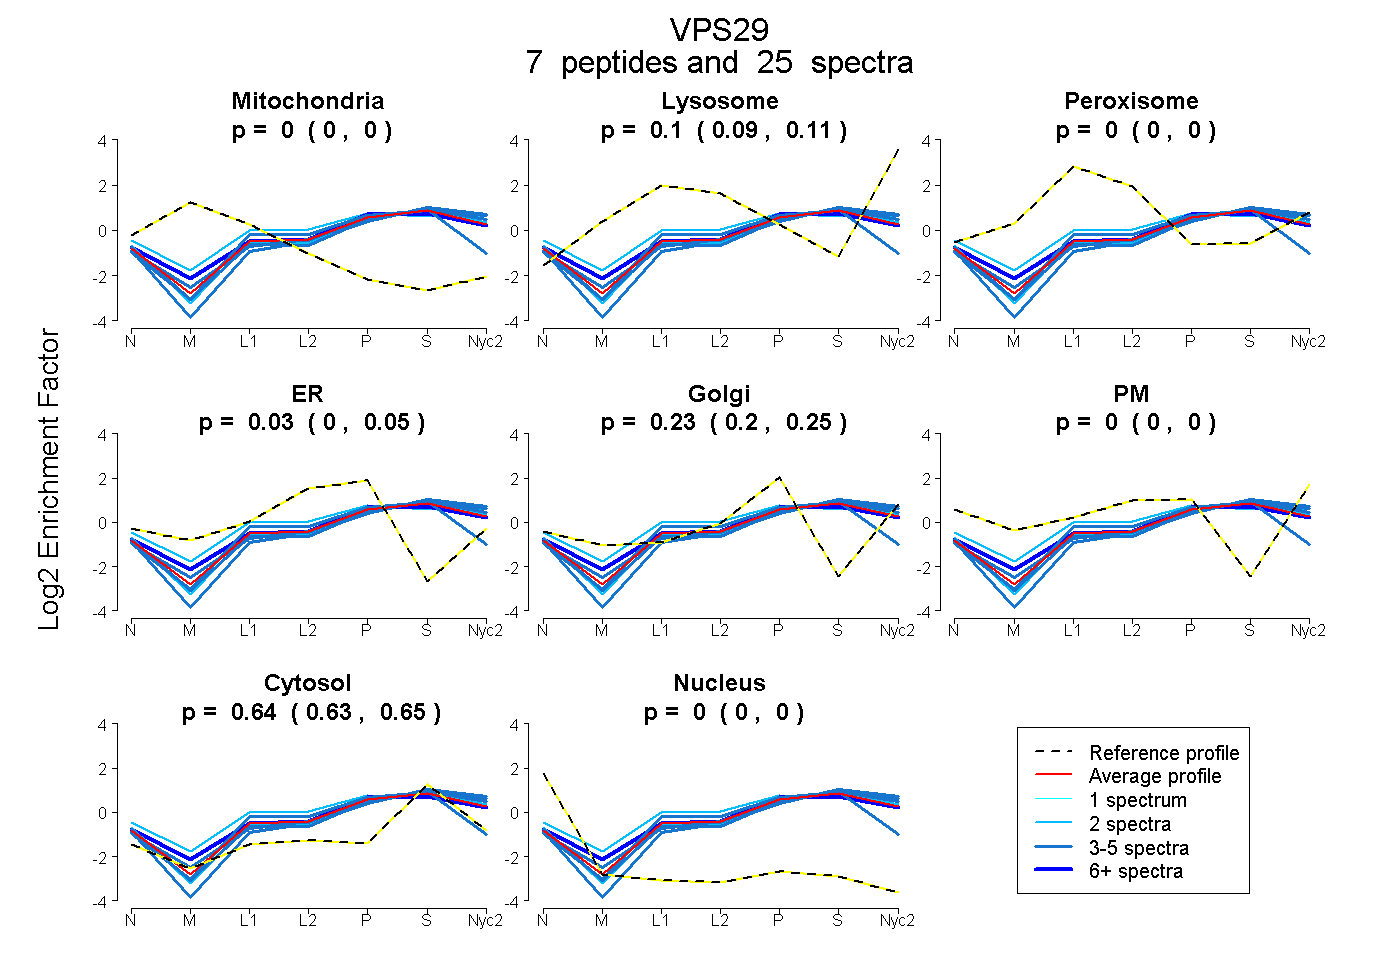
0.000 | 0.000
0.086 | 0.113
0.000 | 0.000
0.000 | 0.054
0.203 | 0.254
0.000 | 0.000
0.630 | 0.646
0.000 | 0.000
6peptides
spectra
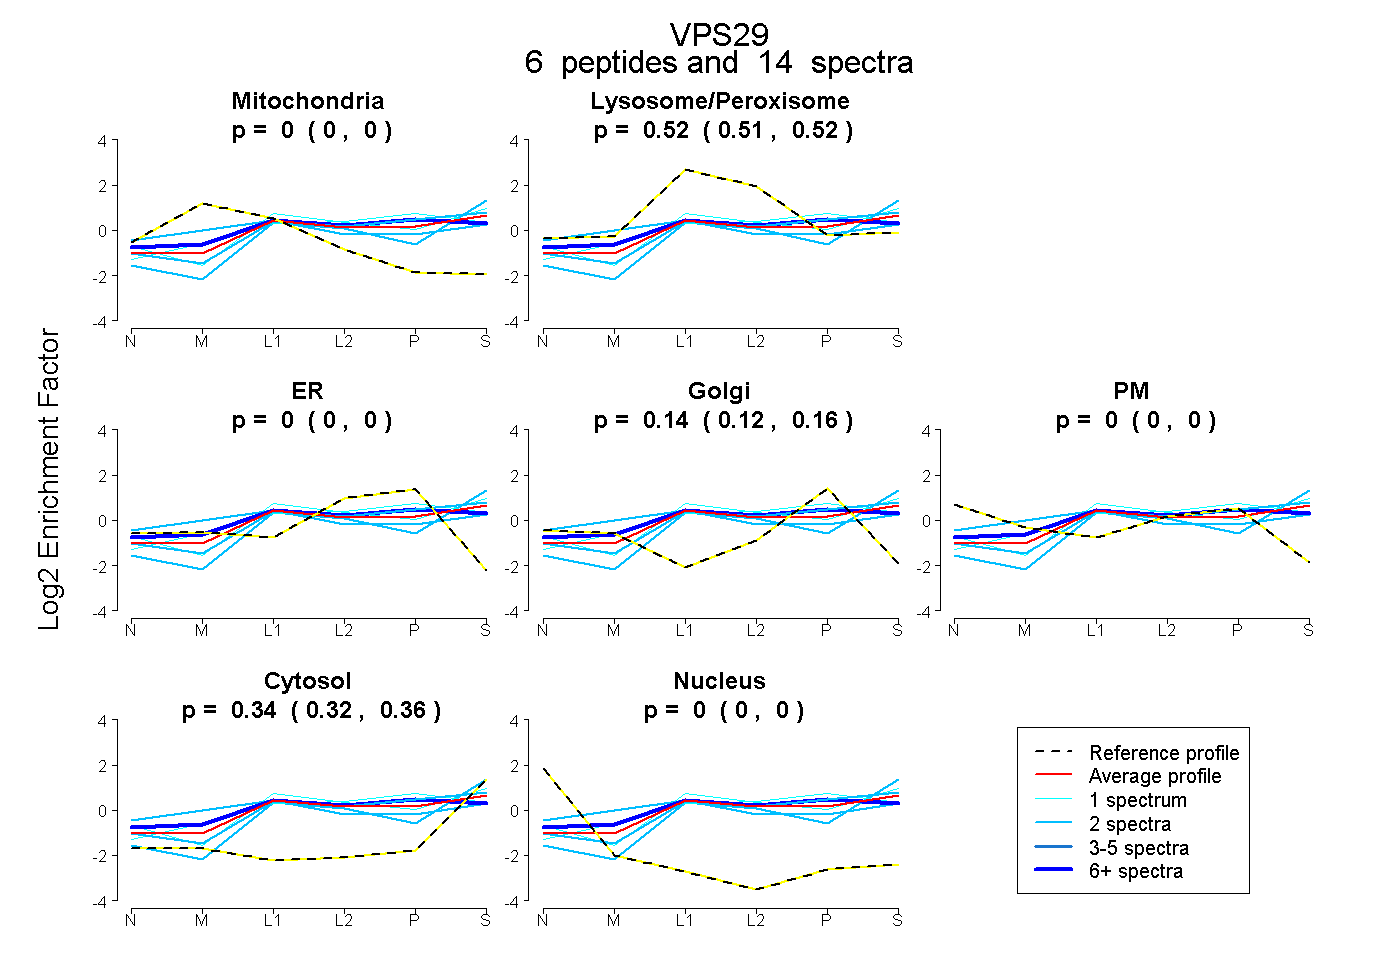
0.000 | 0.000
0.513 | 0.525
0.000 | 0.000
0.119 | 0.159
0.000 | 0.000
0.321 | 0.357
0.000 | 0.000