 7
7peptides
spectra
0.000 | 0.000
0.086 | 0.113
0.000 | 0.000
0.000 | 0.054
0.203 | 0.254
0.000 | 0.000
0.630 | 0.646
0.000 | 0.000
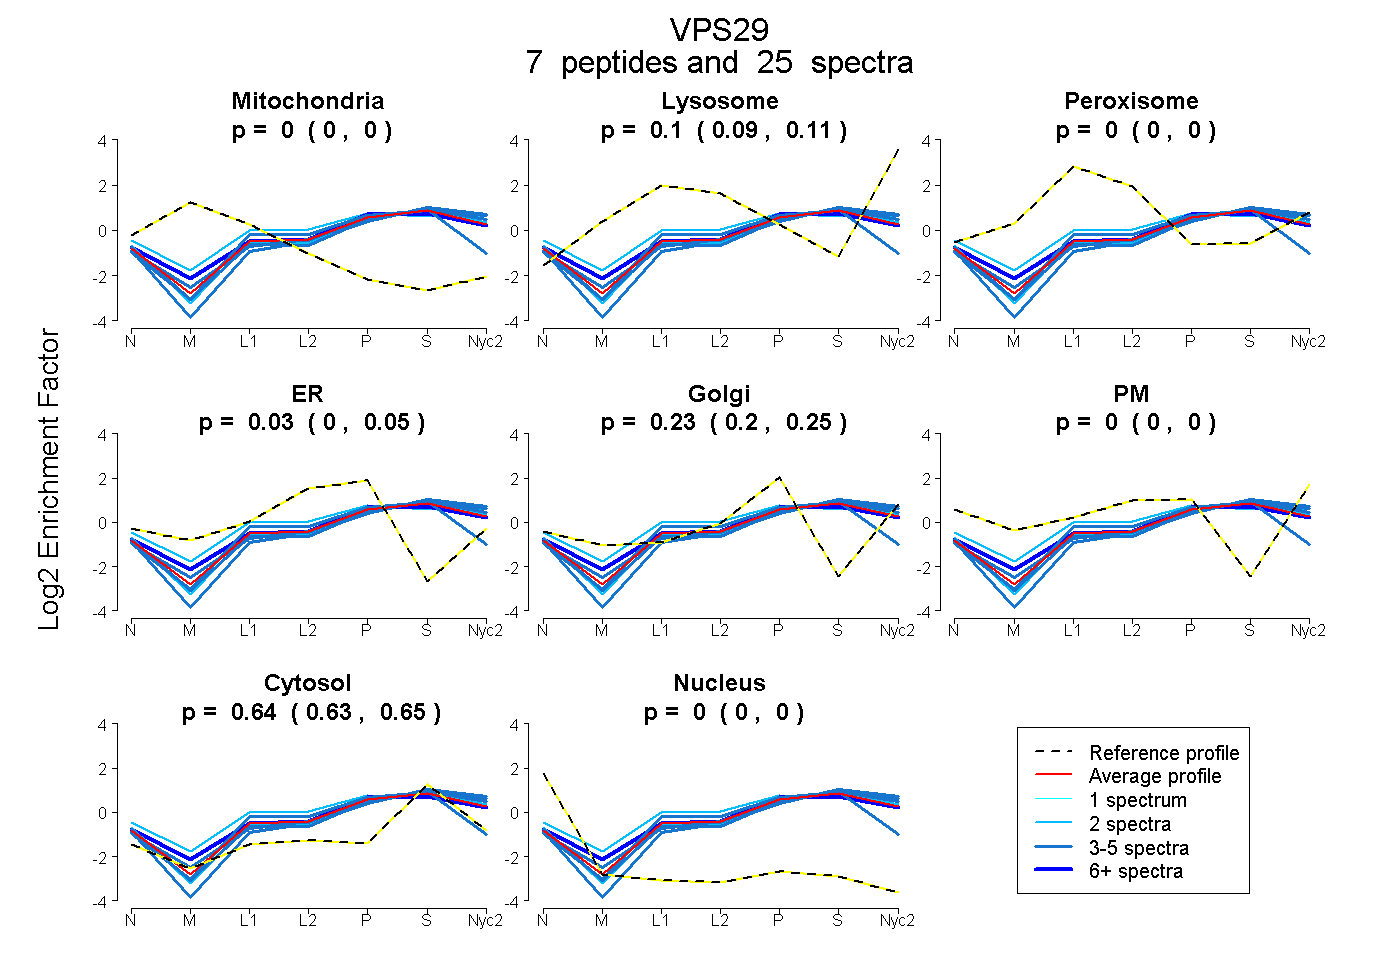
| Plot | Mito | Lyso | Perox | ER | Golgi | PM | Cytosol | Nucleus | |||||
| Expt A |
7 peptides |
25 spectra |
|
0.000 0.000 | 0.000 |
0.102 0.086 | 0.113 |
0.000 0.000 | 0.000 |
0.027 0.000 | 0.054 |
0.233 0.203 | 0.254 |
0.000 0.000 | 0.000 |
0.639 0.630 | 0.646 |
0.000 0.000 | 0.000 |
| 2 spectra, GDFDESLNYPEQK | 0.000 | 0.077 | 0.000 | 0.000 | 0.249 | 0.000 | 0.674 | 0.000 | ||
| 3 spectra, FEAFEHENK | 0.000 | 0.058 | 0.000 | 0.000 | 0.229 | 0.000 | 0.713 | 0.000 | ||
| 3 spectra, VVTVGQFK | 0.000 | 0.085 | 0.000 | 0.000 | 0.246 | 0.000 | 0.670 | 0.000 | ||
| 5 spectra, IQHILCTGNLCTK | 0.000 | 0.000 | 0.000 | 0.280 | 0.000 | 0.000 | 0.720 | 0.000 | ||
| 2 spectra, CNSLPAK | 0.000 | 0.118 | 0.150 | 0.000 | 0.285 | 0.000 | 0.447 | 0.000 | ||
| 6 spectra, ESYDYLK | 0.000 | 0.072 | 0.054 | 0.000 | 0.304 | 0.000 | 0.570 | 0.000 | ||
| 4 spectra, TLAGDVHIVR | 0.000 | 0.177 | 0.000 | 0.001 | 0.210 | 0.000 | 0.612 | 0.000 |
| Plot | Mito | Lyso or Perox | ER | Golgi | PM | Cytosol | Nucleus | ||||||
| Expt B |
6 peptides |
14 spectra |
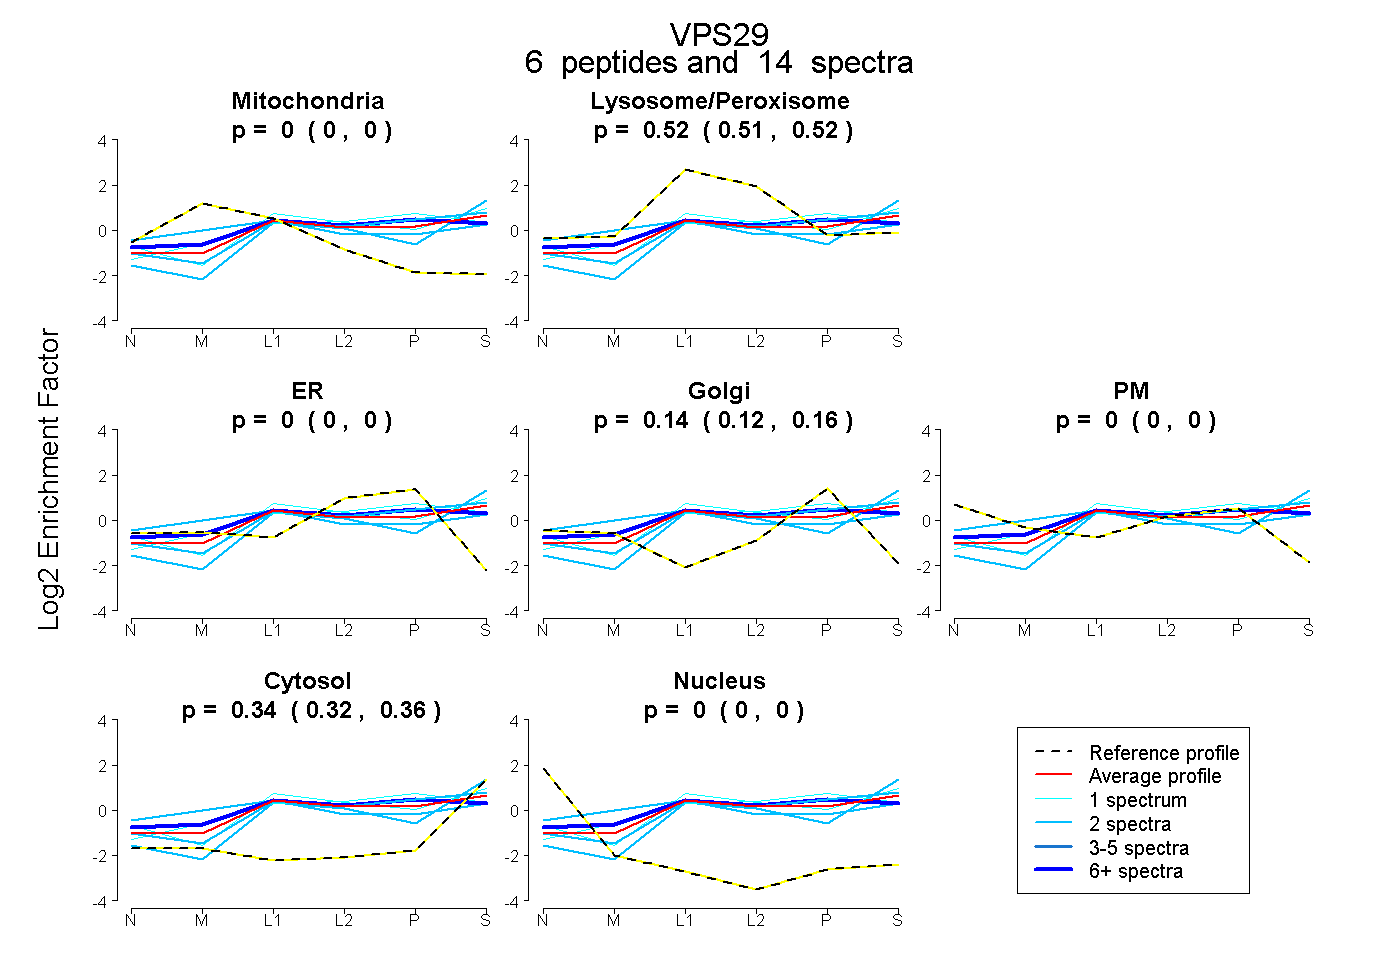 |
0.000 0.000 | 0.000 |
0.519 0.513 | 0.525 |
0.000 0.000 | 0.000 |
0.140 0.119 | 0.159 |
0.000 0.000 | 0.000 |
0.341 0.321 | 0.357 |
0.000 0.000 | 0.000 |
|||
| Plot | Lyso | Other | |||||||||||
| Expt C |
7 peptides |
72 spectra |
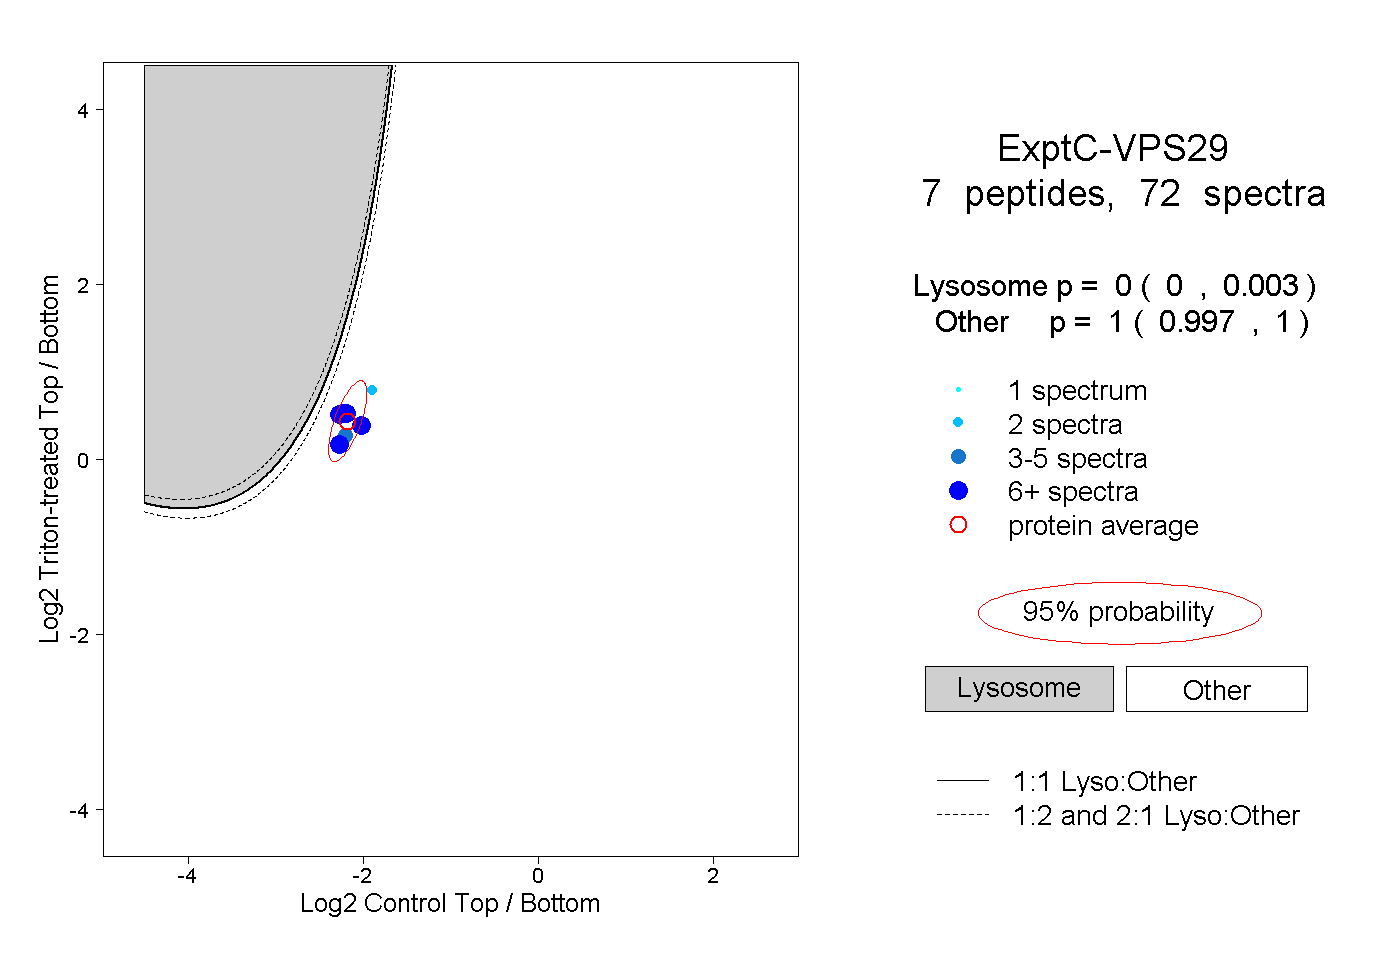 |
0.000 0.000 | 0.003 |
1.000 0.997 | 1.000 |
||||||||
| Plot | Lyso | Other | |||||||||||
| Expt D |
2 peptides |
2 spectra |
 |
0.000 NA | NA |
1.000 NA | NA |