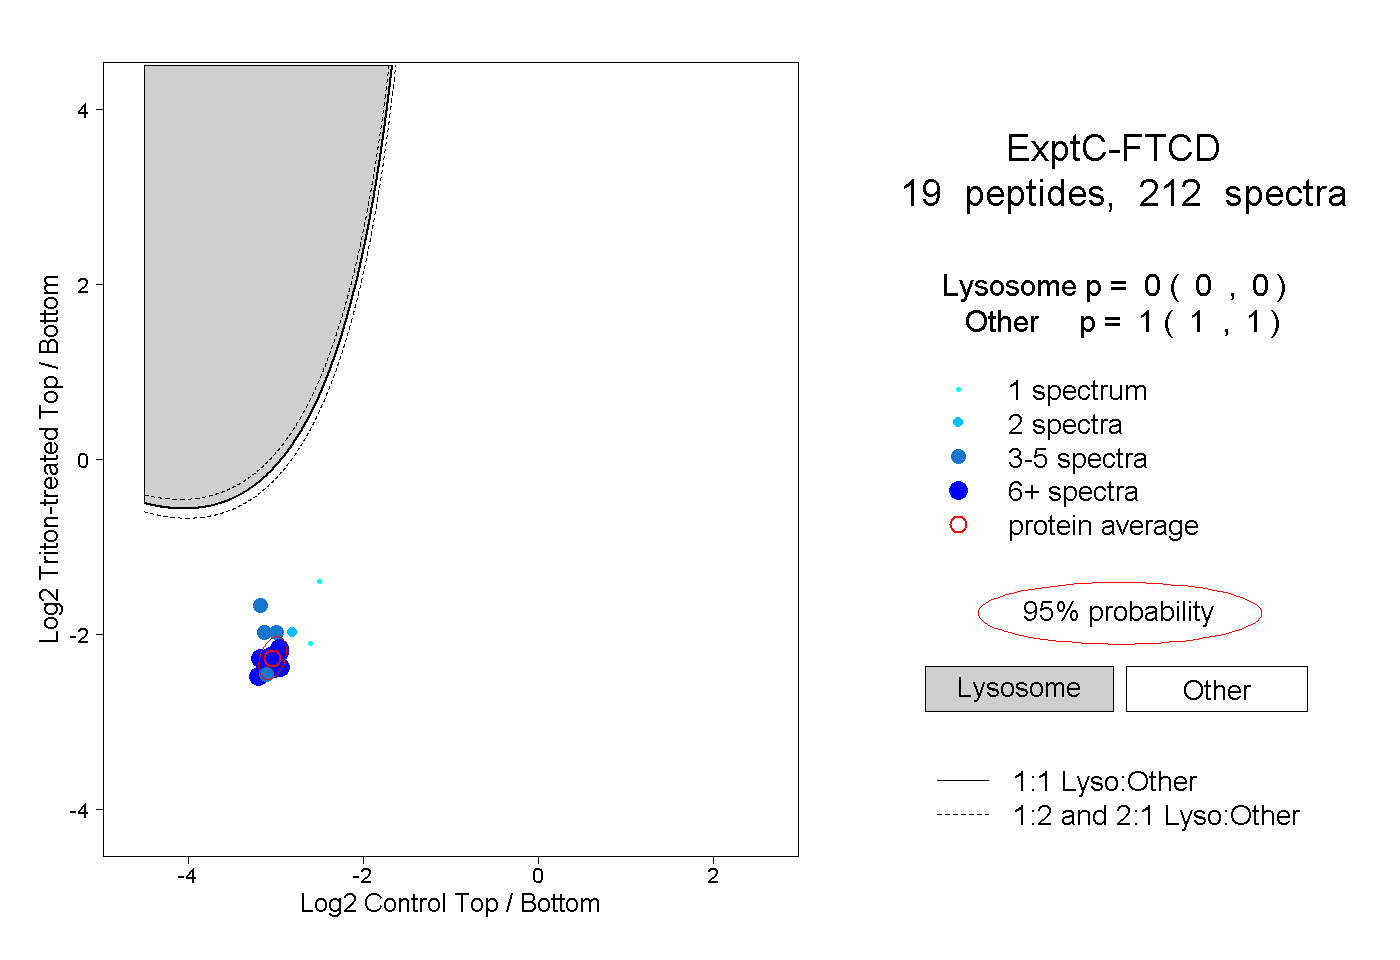
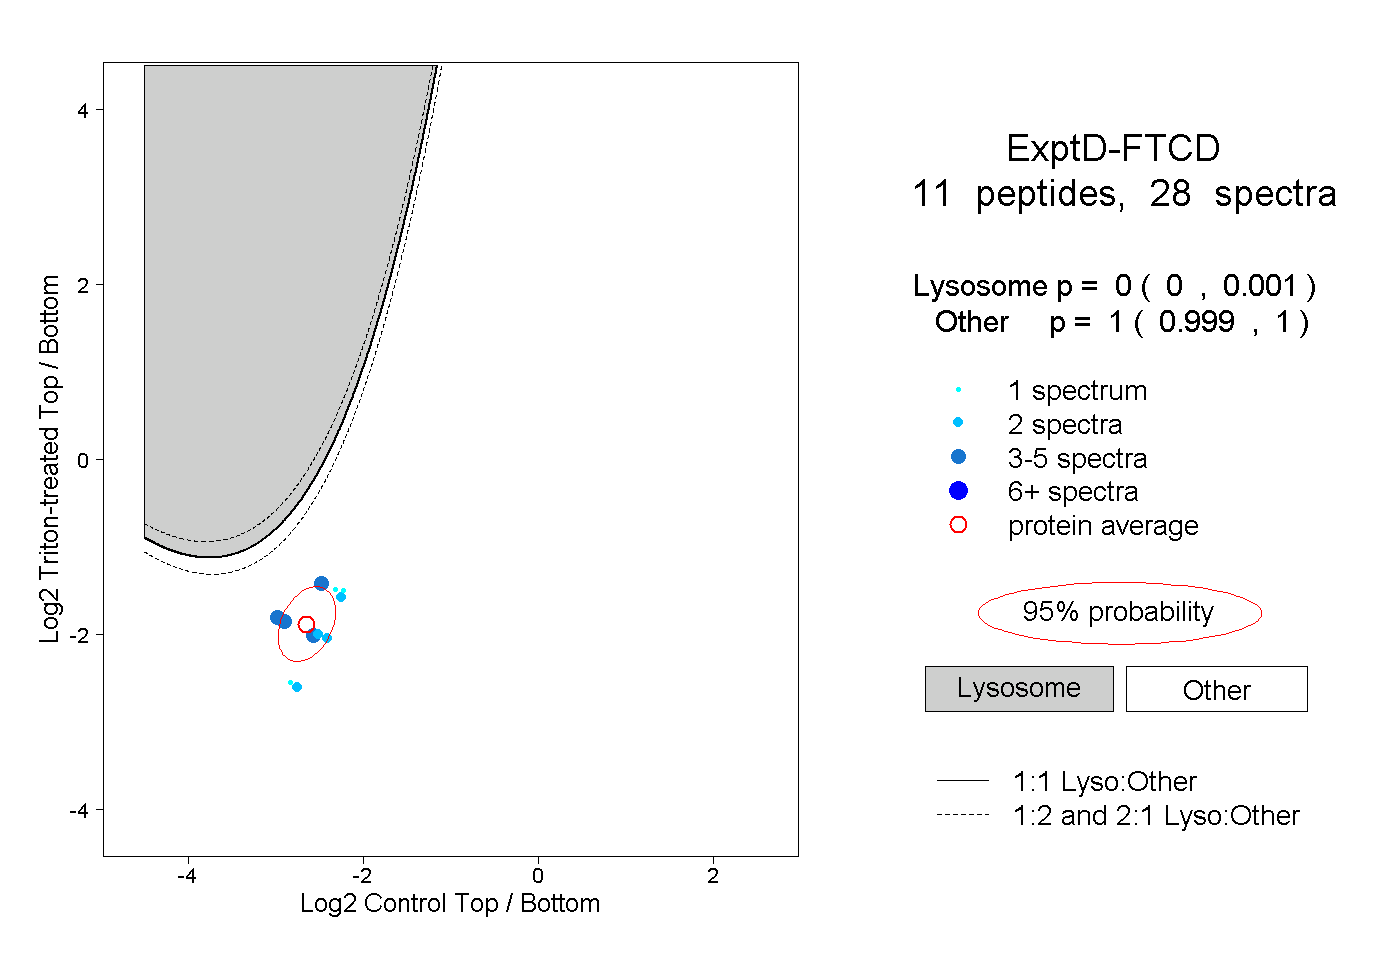
20
20peptides
spectra
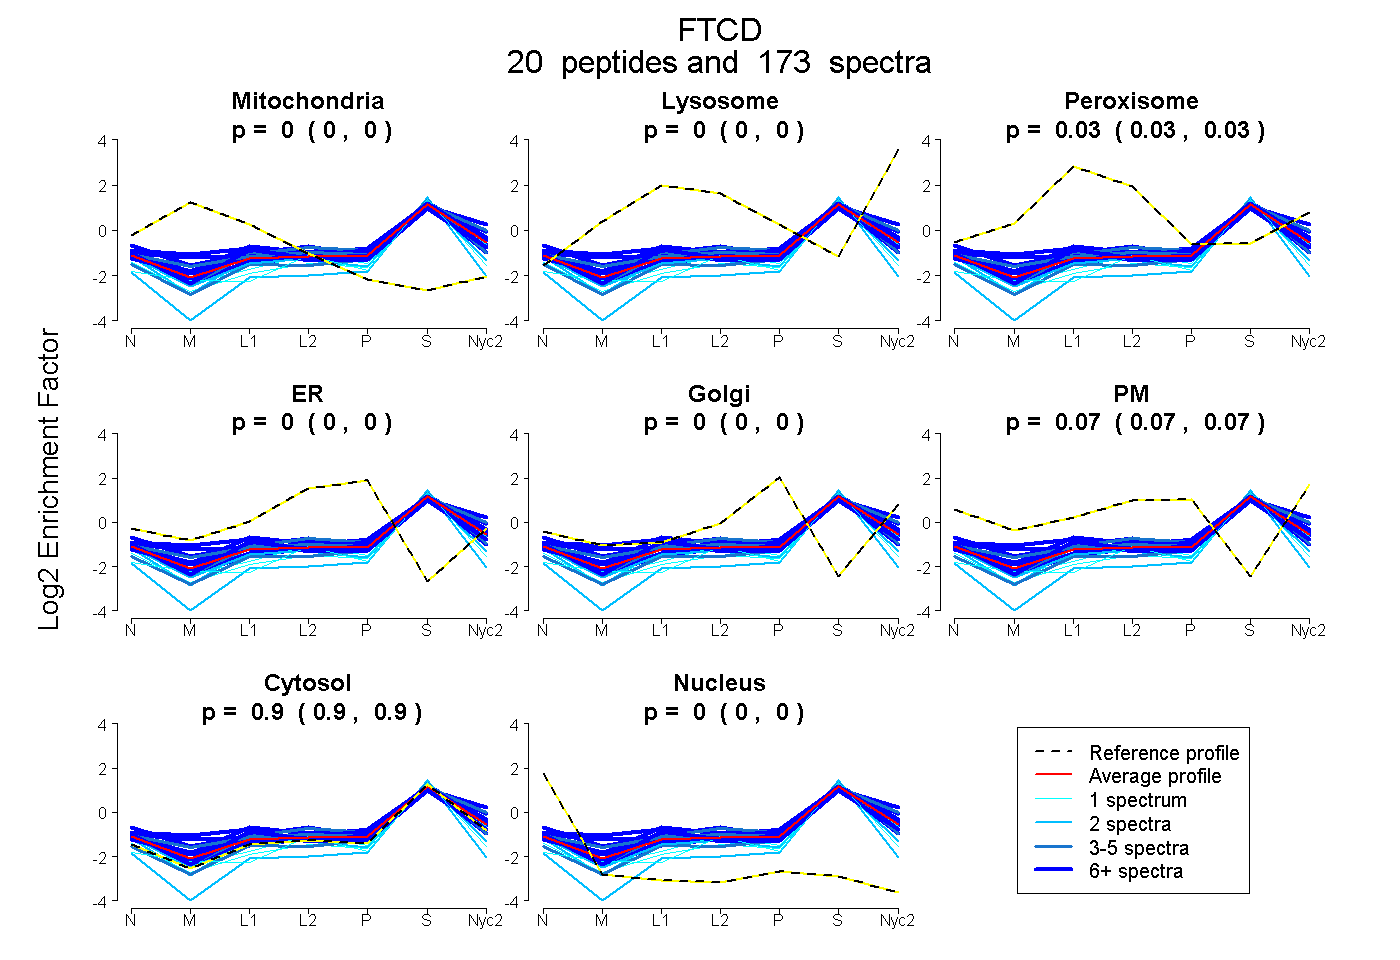
0.000 | 0.001
0.000 | 0.004
0.025 | 0.032
0.000 | 0.000
0.000 | 0.000
0.067 | 0.071
0.898 | 0.902
0.000 | 0.000
15peptides
spectra
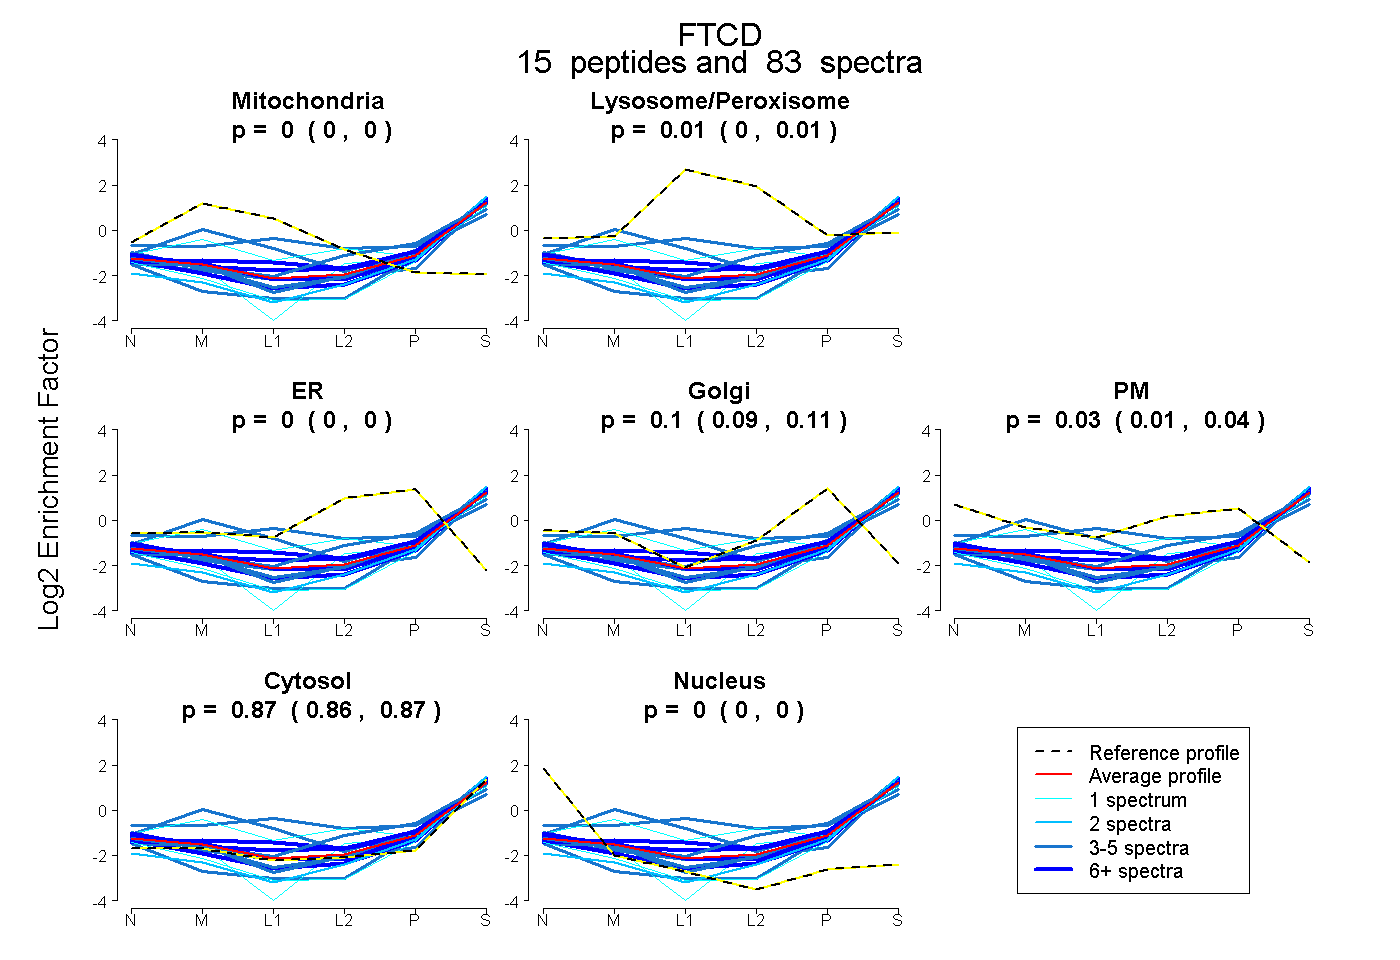
0.000 | 0.000
0.000 | 0.014
0.000 | 0.000
0.094 | 0.112
0.012 | 0.035
0.861 | 0.869
0.000 | 0.000