 20
20peptides
spectra
0.000 | 0.001
0.000 | 0.004
0.025 | 0.032
0.000 | 0.000
0.000 | 0.000
0.067 | 0.071
0.898 | 0.902
0.000 | 0.000
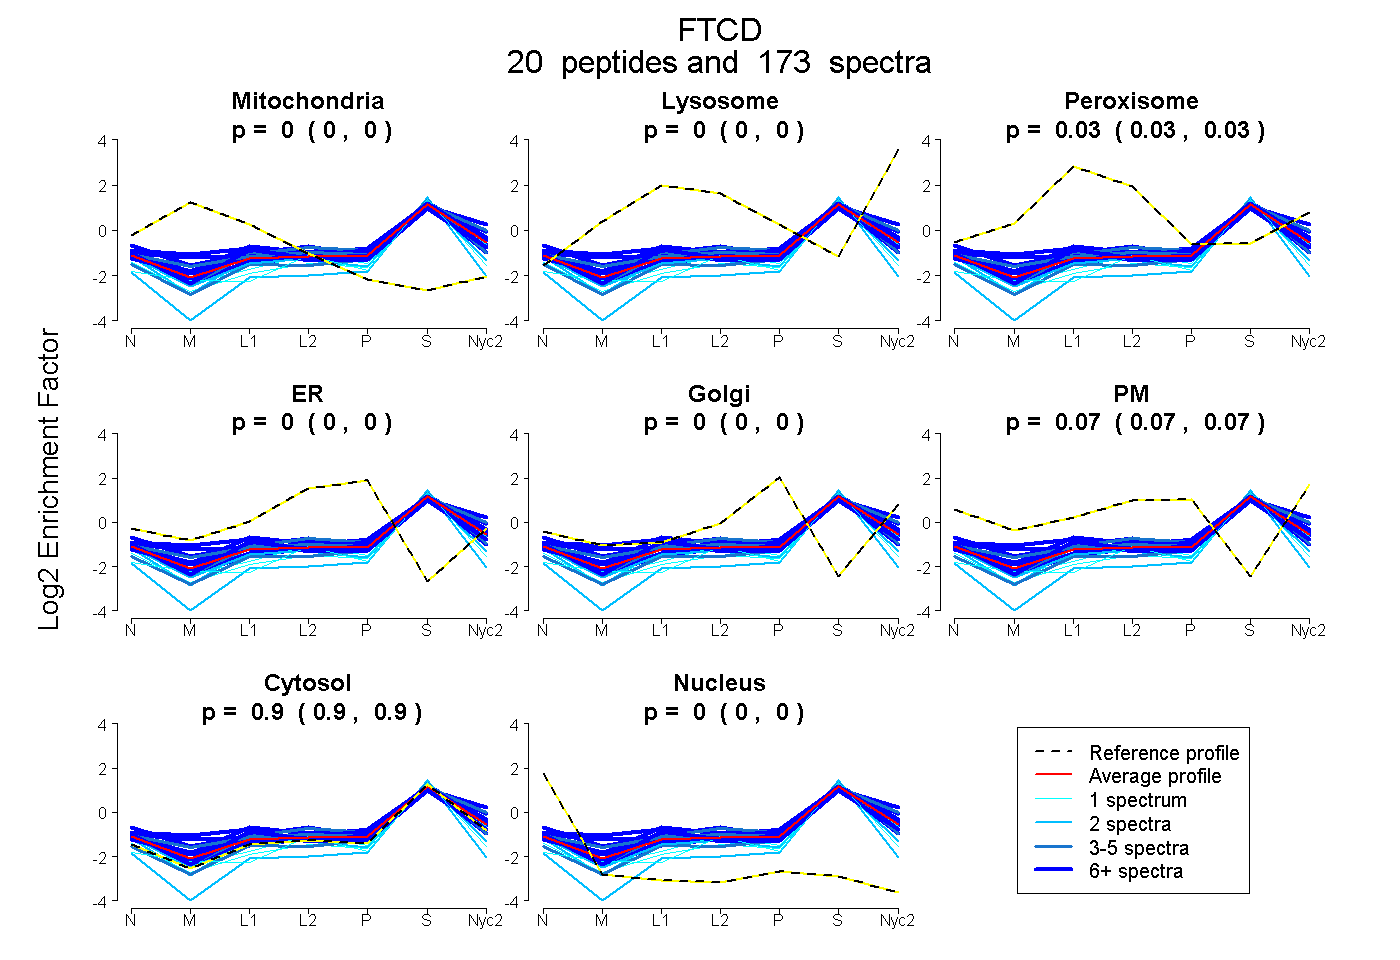
| Plot | Mito | Lyso | Perox | ER | Golgi | PM | Cytosol | Nucleus | |||||
| Expt A |
20 peptides |
173 spectra |
|
0.000 0.000 | 0.001 |
0.000 0.000 | 0.004 |
0.030 0.025 | 0.032 |
0.000 0.000 | 0.000 |
0.000 0.000 | 0.000 |
0.070 0.067 | 0.071 |
0.900 0.898 | 0.902 |
0.000 0.000 | 0.000 |
| 12 spectra, AGEYEALPEK | 0.000 | 0.037 | 0.110 | 0.000 | 0.031 | 0.027 | 0.794 | 0.000 | ||
| 3 spectra, TQAALVLGSLEAR | 0.010 | 0.128 | 0.000 | 0.000 | 0.000 | 0.034 | 0.827 | 0.000 | ||
| 1 spectrum, LGLDSLAPFDPK | 0.000 | 0.000 | 0.000 | 0.000 | 0.000 | 0.000 | 0.986 | 0.014 | ||
| 1 spectrum, IIEYLVPDSGPEQSLLDASLR | 0.000 | 0.000 | 0.000 | 0.000 | 0.000 | 0.030 | 0.970 | 0.000 | ||
| 7 spectra, VQGIGWYLEEK | 0.000 | 0.000 | 0.066 | 0.000 | 0.000 | 0.045 | 0.889 | 0.000 | ||
| 7 spectra, TCALQEGLR | 0.000 | 0.084 | 0.000 | 0.000 | 0.051 | 0.000 | 0.866 | 0.000 | ||
| 4 spectra, QFDHLDSTMR | 0.000 | 0.082 | 0.000 | 0.000 | 0.000 | 0.066 | 0.852 | 0.000 | ||
| 6 spectra, TASQLIDMR | 0.072 | 0.139 | 0.000 | 0.000 | 0.000 | 0.020 | 0.769 | 0.000 | ||
| 2 spectra, ALLDAAAFYCDK | 0.000 | 0.000 | 0.000 | 0.000 | 0.000 | 0.000 | 0.897 | 0.103 | ||
| 1 spectrum, TVYTFVGQPECVVEGALSAAR | 0.000 | 0.000 | 0.000 | 0.000 | 0.000 | 0.000 | 0.958 | 0.042 | ||
| 19 spectra, QTLPAIR | 0.171 | 0.011 | 0.077 | 0.000 | 0.000 | 0.000 | 0.741 | 0.000 | ||
| 24 spectra, DMTDDVFK | 0.048 | 0.074 | 0.000 | 0.000 | 0.000 | 0.003 | 0.875 | 0.000 | ||
| 9 spectra, ISSLLQEAK | 0.000 | 0.119 | 0.015 | 0.000 | 0.000 | 0.097 | 0.769 | 0.000 | ||
| 7 spectra, LIPPFHAASAQLTSLVDADAR | 0.000 | 0.051 | 0.004 | 0.000 | 0.000 | 0.061 | 0.884 | 0.000 | ||
| 2 spectra, AFAACLGAIK | 0.000 | 0.000 | 0.000 | 0.000 | 0.000 | 0.000 | 0.953 | 0.047 | ||
| 2 spectra, NTPEER | 0.000 | 0.019 | 0.000 | 0.000 | 0.000 | 0.033 | 0.948 | 0.000 | ||
| 9 spectra, GVSMDECVLCAK | 0.000 | 0.000 | 0.029 | 0.089 | 0.000 | 0.000 | 0.879 | 0.003 | ||
| 27 spectra, LFVLEEEHR | 0.000 | 0.000 | 0.000 | 0.010 | 0.064 | 0.039 | 0.887 | 0.000 | ||
| 5 spectra, MGALDVCPFIPVR | 0.000 | 0.000 | 0.000 | 0.000 | 0.000 | 0.000 | 0.991 | 0.009 | ||
| 25 spectra, IALNLR | 0.000 | 0.012 | 0.000 | 0.000 | 0.000 | 0.062 | 0.926 | 0.000 |
| Plot | Mito | Lyso or Perox | ER | Golgi | PM | Cytosol | Nucleus | ||||||
| Expt B |
15 peptides |
83 spectra |
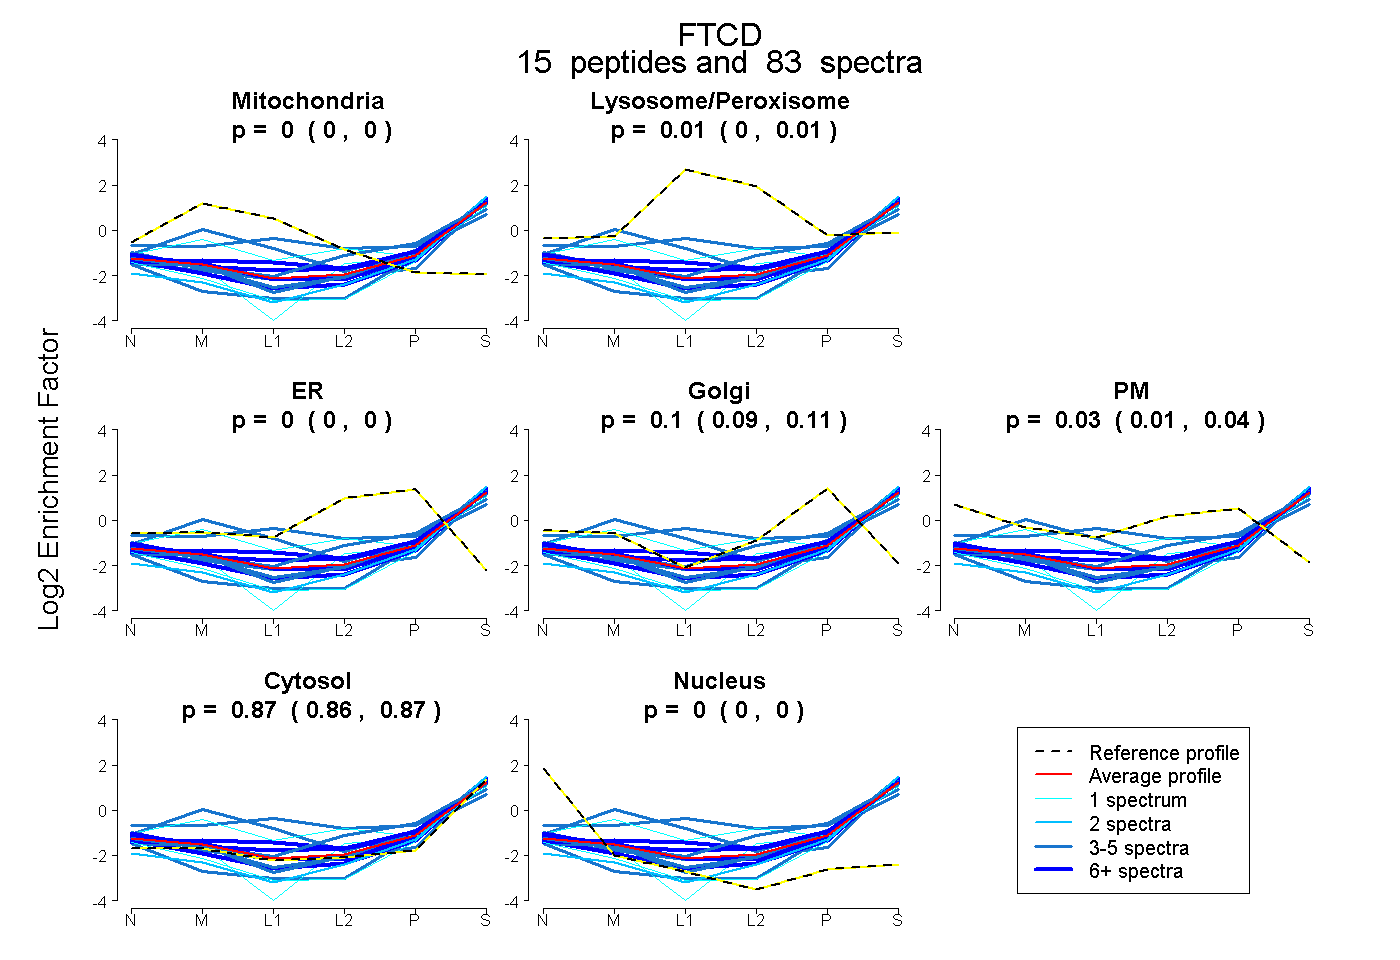 |
0.000 0.000 | 0.000 |
0.007 0.000 | 0.014 |
0.000 0.000 | 0.000 |
0.103 0.094 | 0.112 |
0.025 0.012 | 0.035 |
0.865 0.861 | 0.869 |
0.000 0.000 | 0.000 |
|||
| Plot | Lyso | Other | |||||||||||
| Expt C |
19 peptides |
212 spectra |
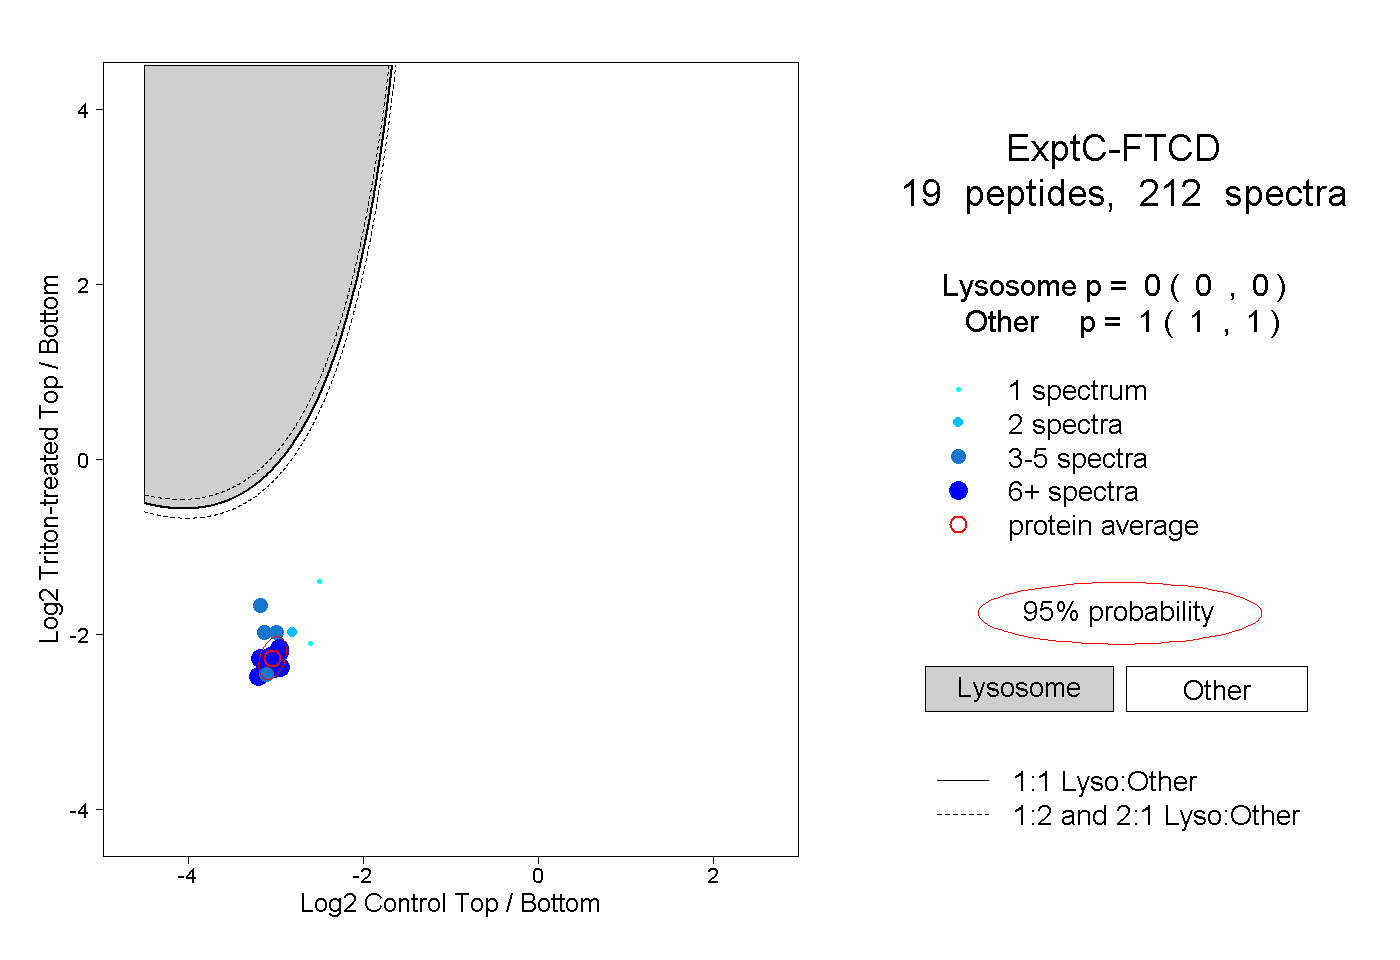 |
0.000 0.000 | 0.000 |
1.000 1.000 | 1.000 |
||||||||
| Plot | Lyso | Other | |||||||||||
| Expt D |
11 peptides |
28 spectra |
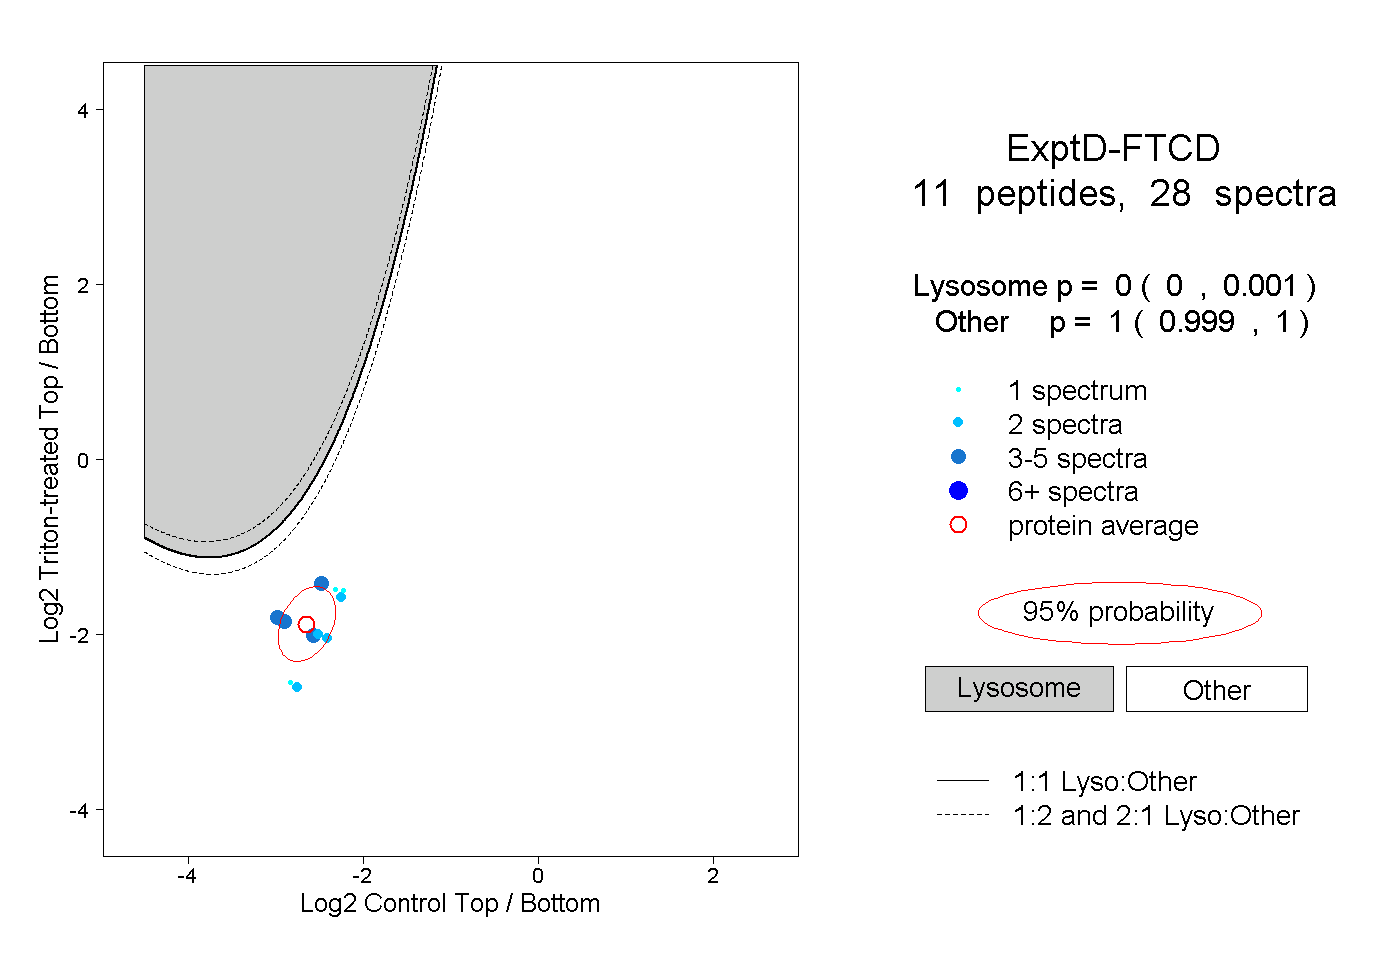 |
0.000 0.000 | 0.001 |
1.000 0.999 | 1.000 |