 8
8peptides
spectra
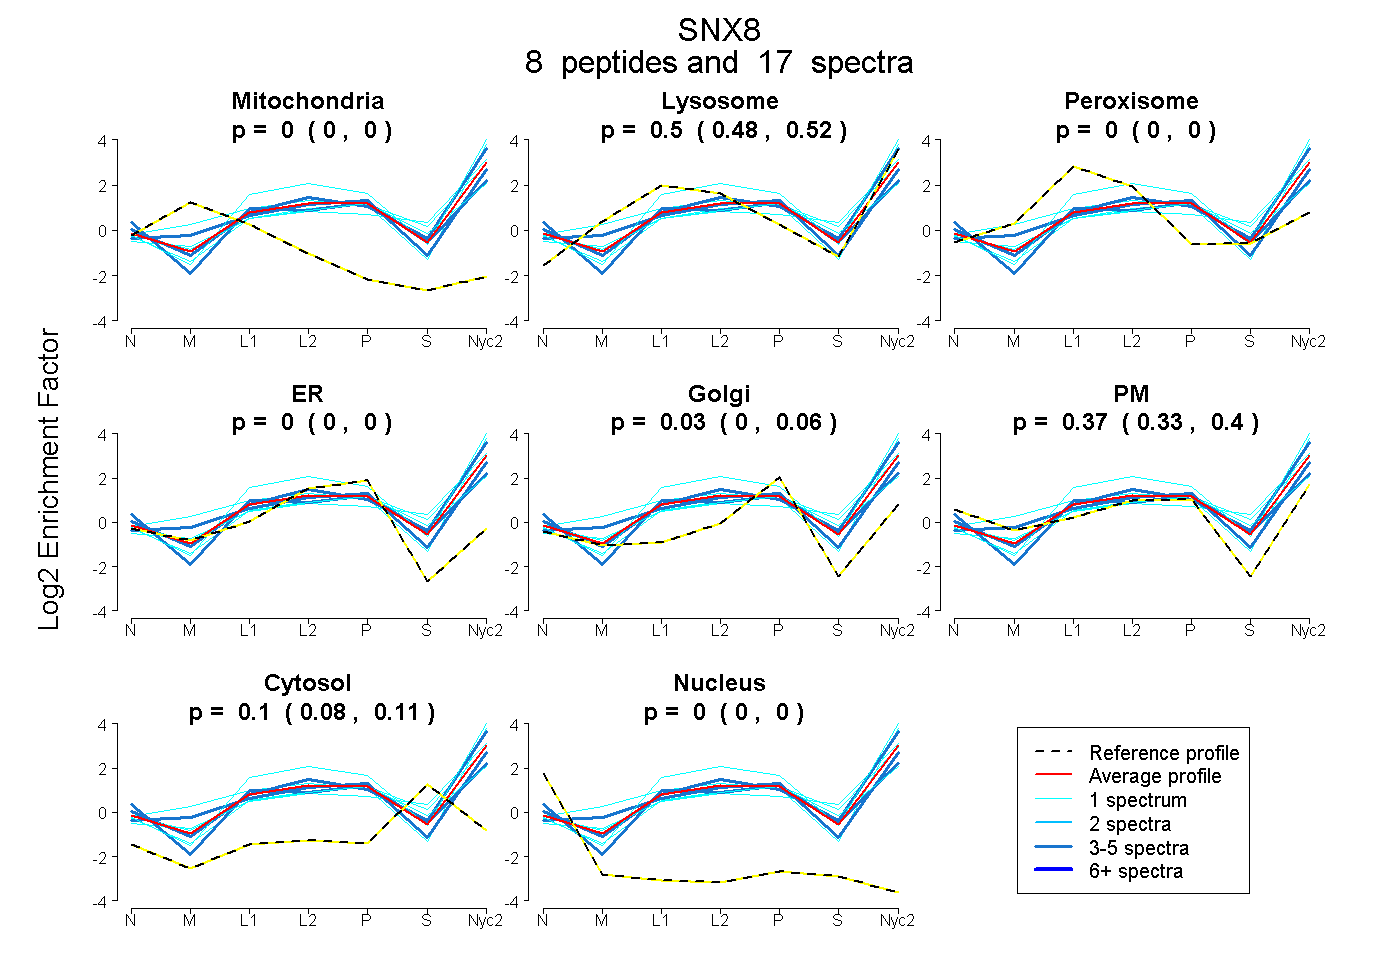
0.000 | 0.000
0.476 | 0.517
0.000 | 0.000
0.000 | 0.000
0.002 | 0.059
0.331 | 0.398
0.083 | 0.113
0.000 | 0.000
1peptide
spectra
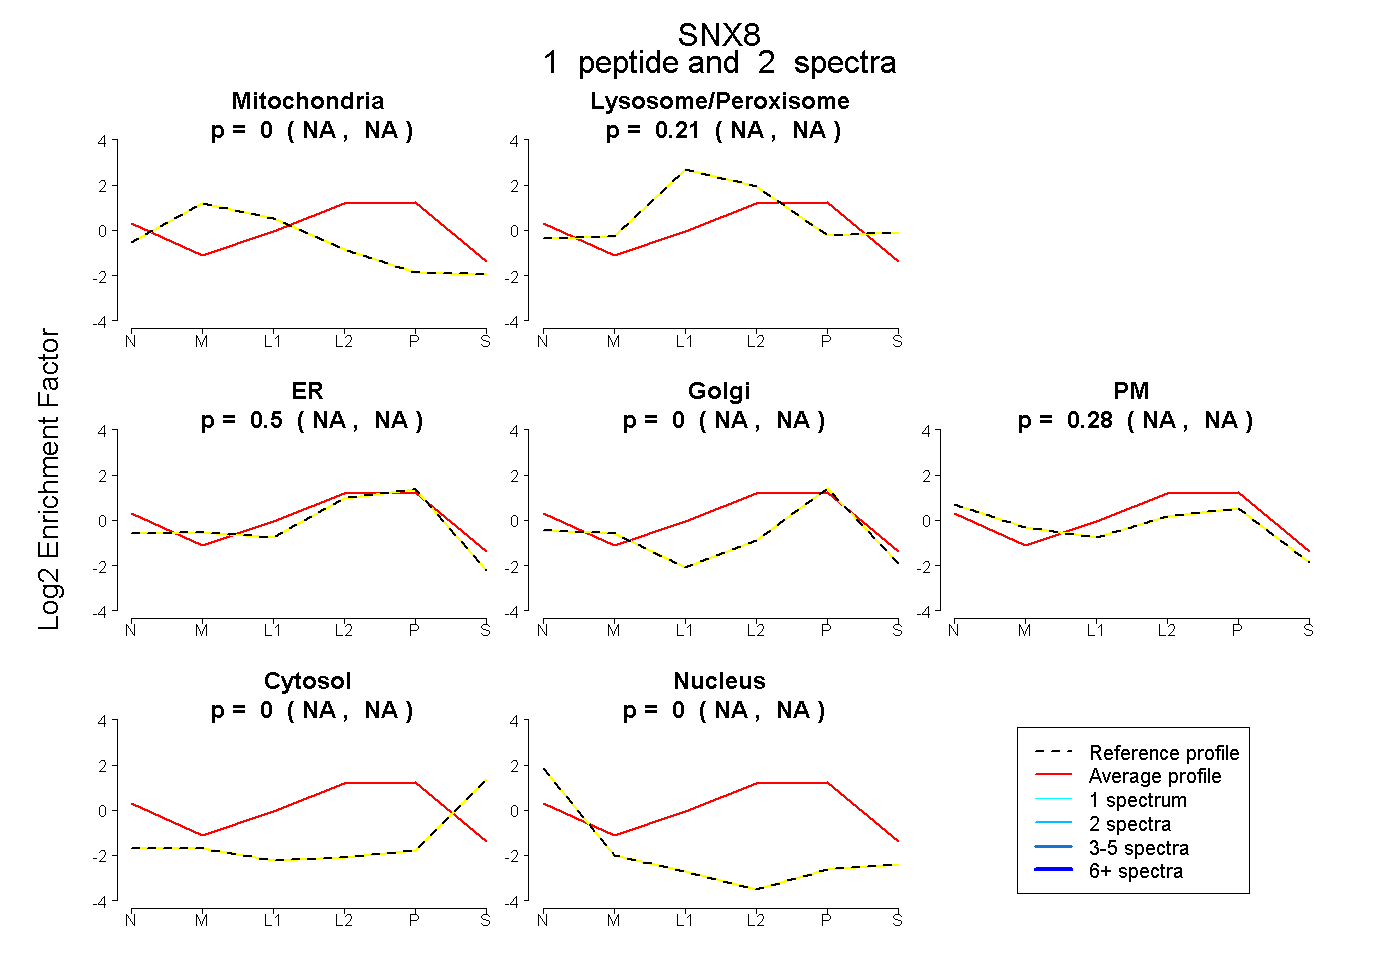
NA | NA
NA | NA
NA | NA
NA | NA
NA | NA
NA | NA
NA | NA
9peptides
spectra
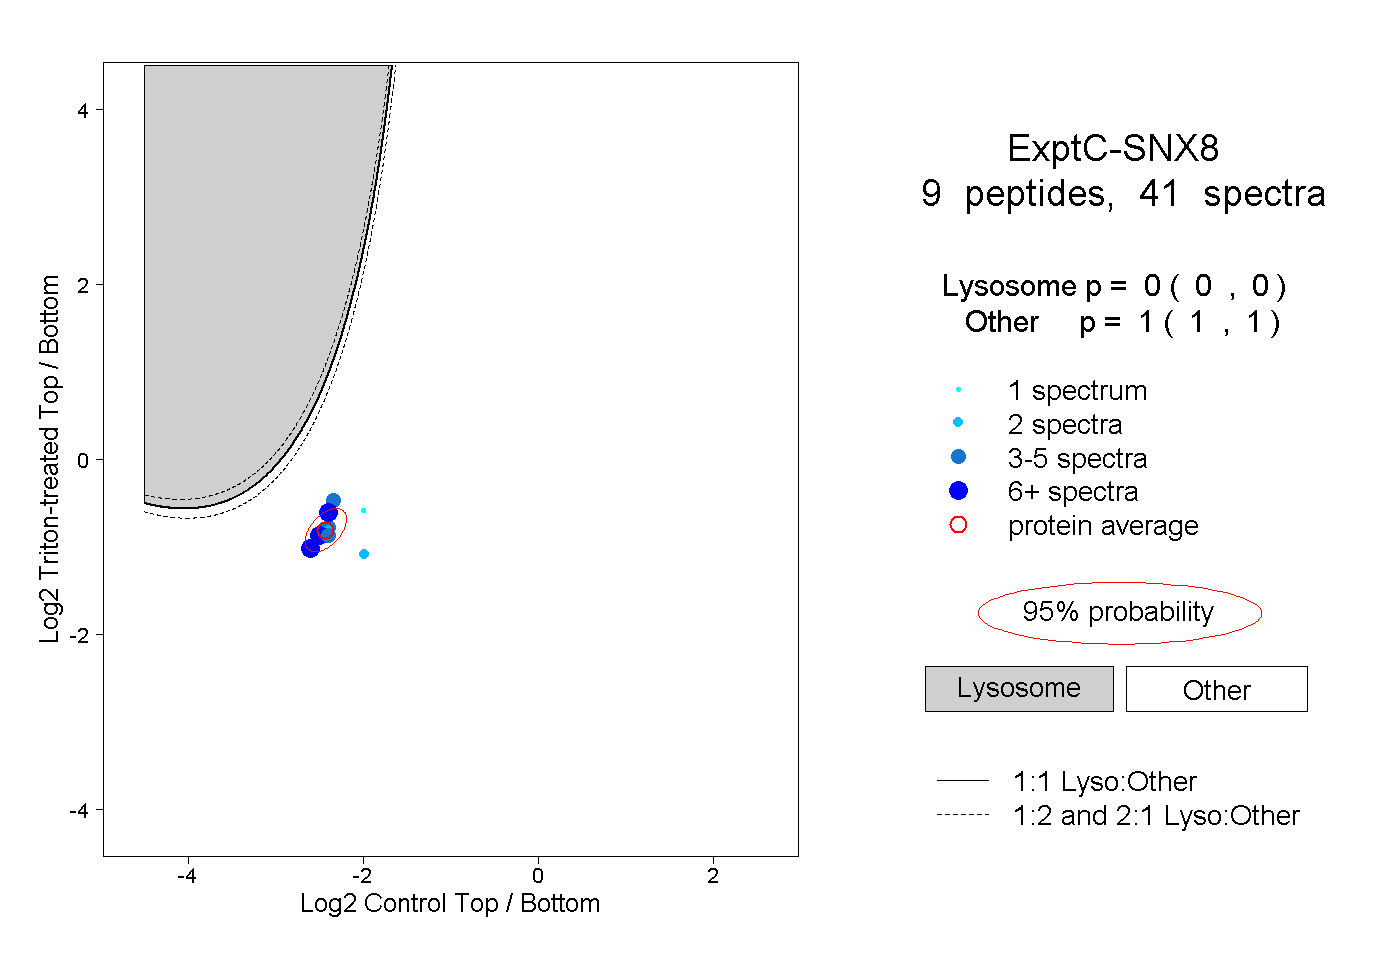
0.000 | 0.000
1.000 | 1.000
2peptides
spectra
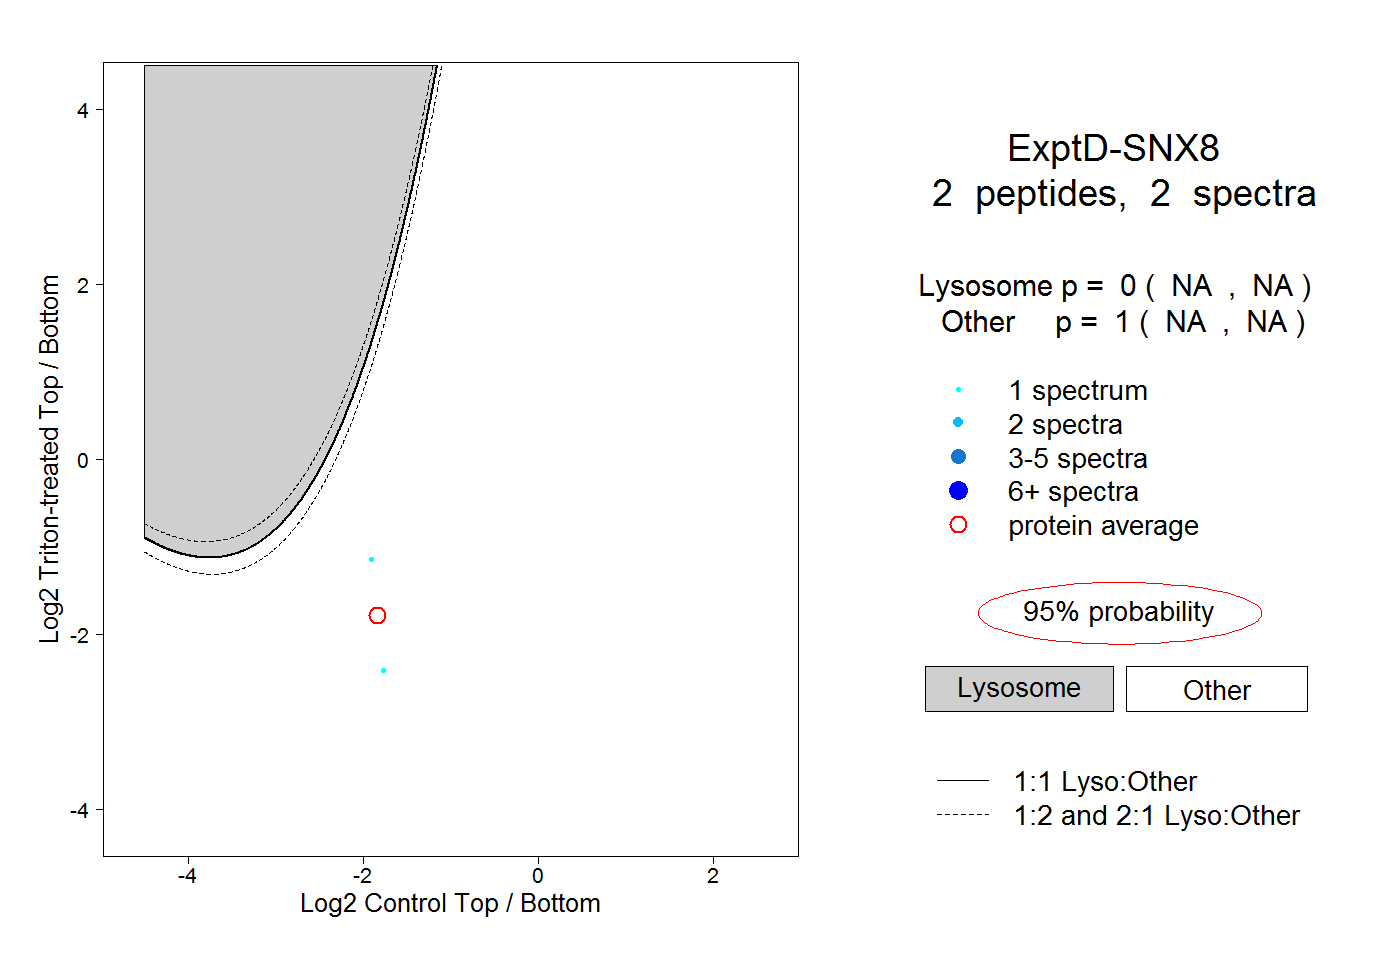
NA | NA
NA | NA