 1
1peptide
spectra
0.000 | 0.000
0.000 | 0.000
0.000 | 0.022
0.000 | 0.350
0.001 | 0.198
0.054 | 0.342
0.442 | 0.505
0.000 | 0.030
1peptide
spectrum
NA | NA
NA | NA
NA | NA
NA | NA
NA | NA
NA | NA
NA | NA
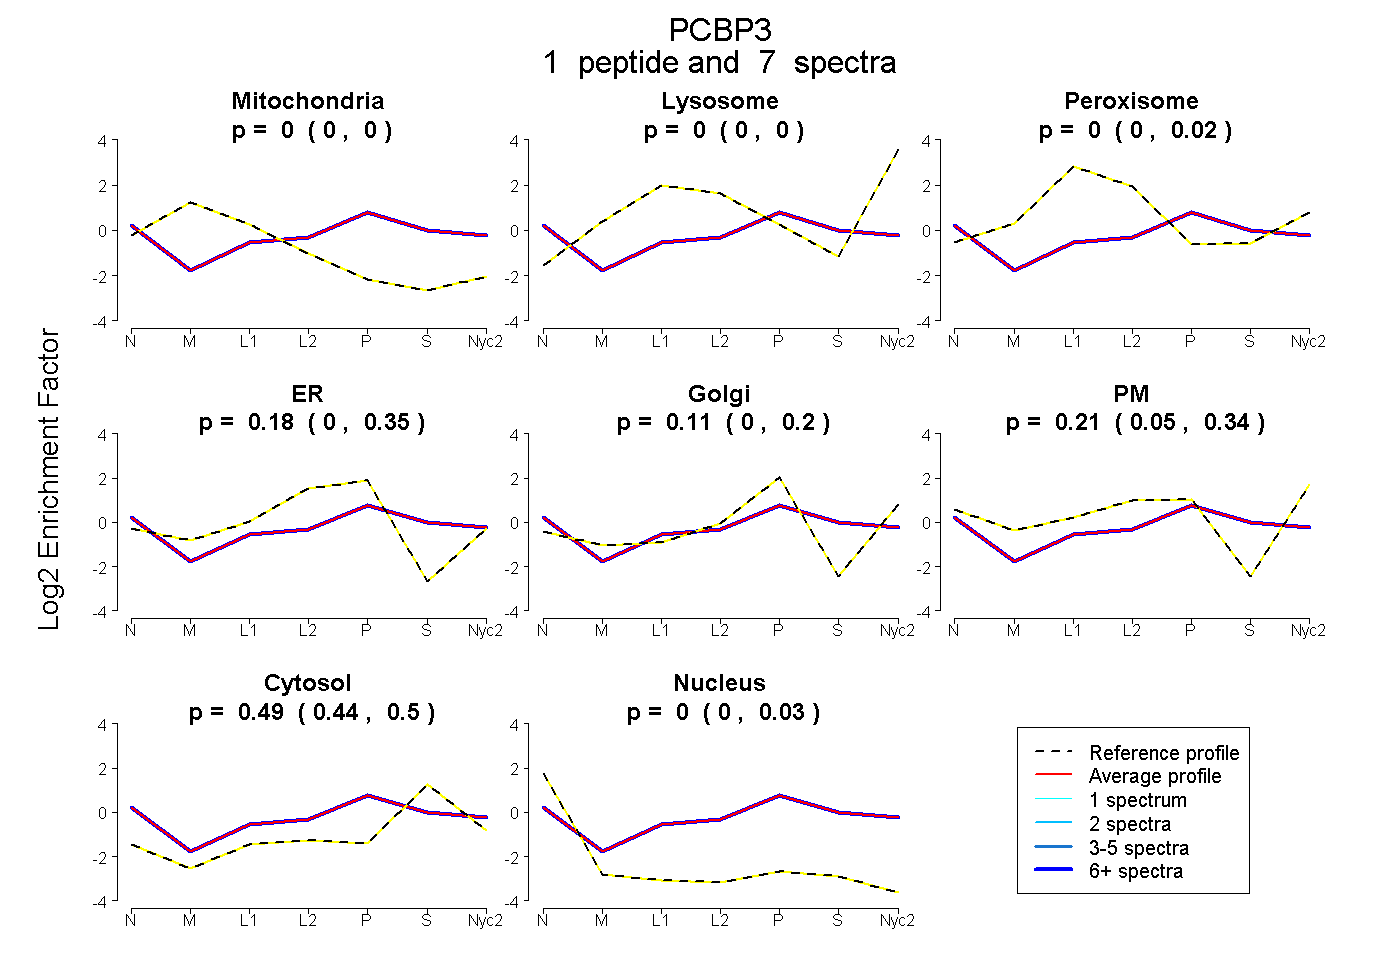
| Plot | Mito | Lyso | Perox | ER | Golgi | PM | Cytosol | Nucleus | |||||
| Expt A |
1 peptide |
7 spectra |
|
0.000 0.000 | 0.000 |
0.000 0.000 | 0.000 |
0.000 0.000 | 0.022 |
0.184 0.000 | 0.350 |
0.114 0.001 | 0.198 |
0.214 0.054 | 0.342 |
0.489 0.442 | 0.505 |
0.000 0.000 | 0.030 |
||
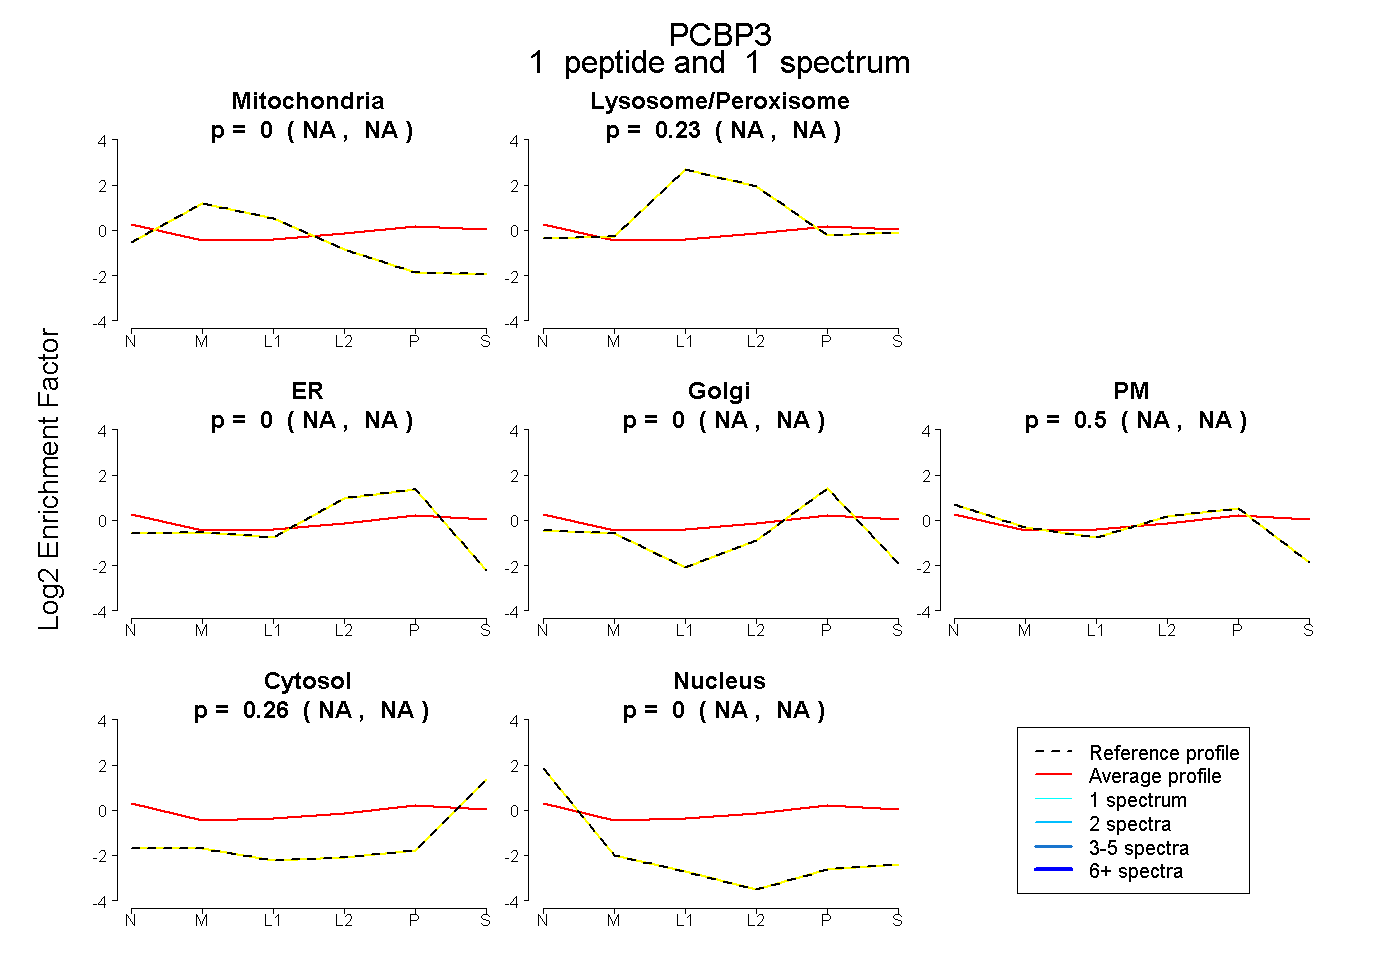
| Plot | Mito | Lyso or Perox | ER | Golgi | PM | Cytosol | Nucleus | ||||||
| Expt B |
1 peptide |
1 spectrum |
|
0.000 NA | NA |
0.234 NA | NA |
0.000 NA | NA |
0.000 NA | NA |
0.502 NA | NA |
0.264 NA | NA |
0.000 NA | NA |