 7
7peptides
spectra
0.000 | 0.000
0.000 | 0.000
0.000 | 0.016
0.000 | 0.045
0.000 | 0.023
0.000 | 0.065
0.892 | 0.911
0.024 | 0.042
| Plot | Mito | Lyso | Perox | ER | Golgi | PM | Cytosol | Nucleus | |||||
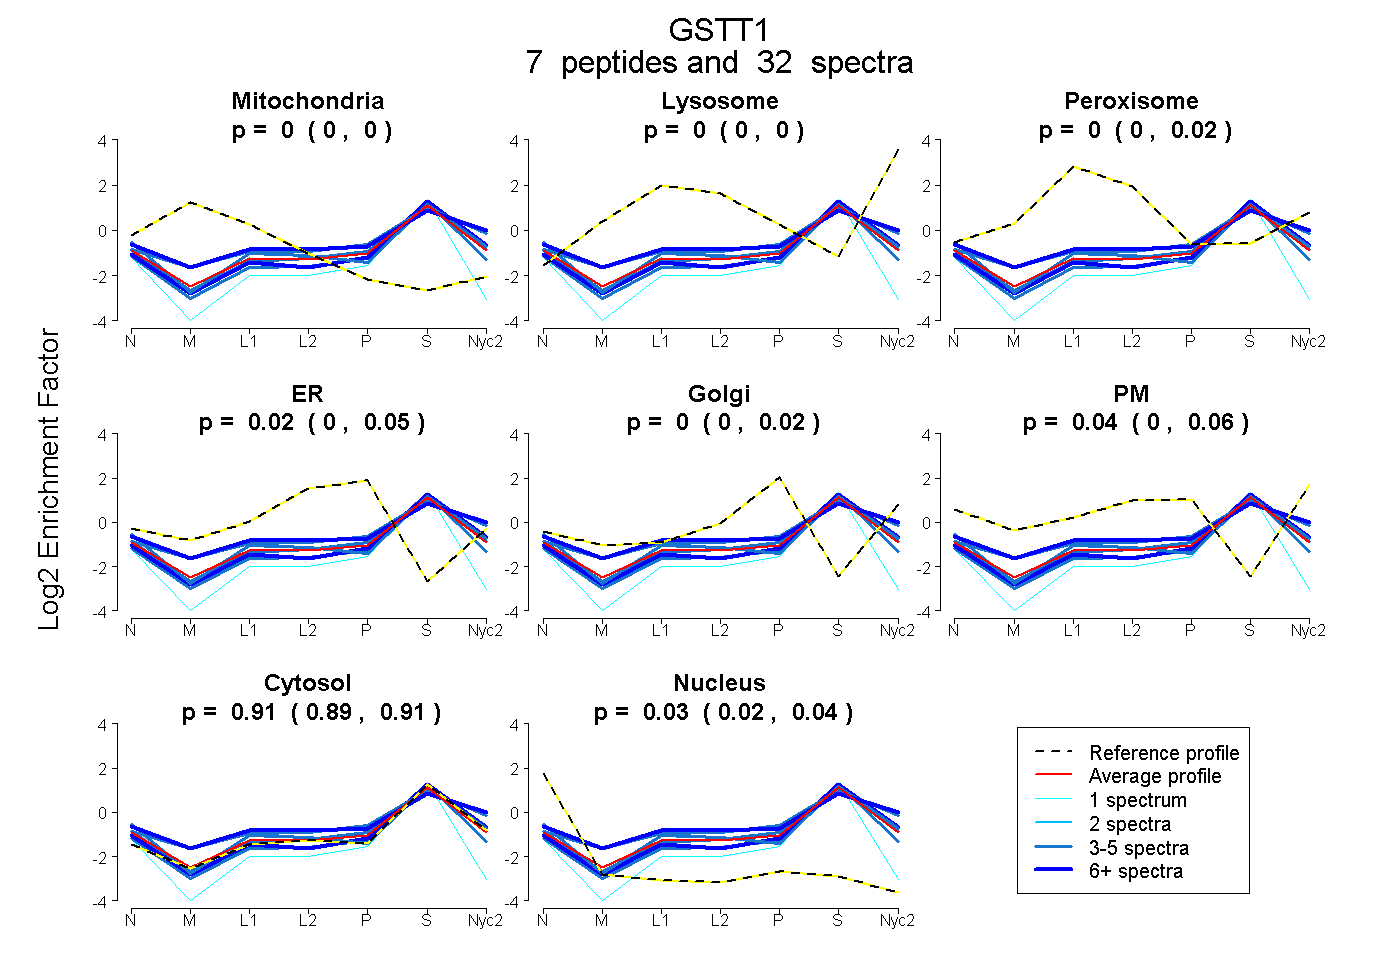
| Expt A |
7 peptides |
32 spectra |
|
0.000 0.000 | 0.000 |
0.000 0.000 | 0.000 |
0.000 0.000 | 0.016 |
0.020 0.000 | 0.045 |
0.000 0.000 | 0.023 |
0.042 0.000 | 0.065 |
0.906 0.892 | 0.911 |
0.033 0.024 | 0.042 |
| 5 spectra, DLFLEAHEVILK | 0.000 | 0.000 | 0.000 | 0.000 | 0.000 | 0.000 | 0.930 | 0.070 | ||
| 4 spectra, NNIPFQMHTVELR | 0.000 | 0.053 | 0.026 | 0.000 | 0.009 | 0.135 | 0.777 | 0.000 | ||
| 8 spectra, LAAWYR | 0.000 | 0.000 | 0.000 | 0.000 | 0.009 | 0.000 | 0.964 | 0.027 | ||
| 7 spectra, VPDHWYPQDLQAR | 0.000 | 0.034 | 0.047 | 0.000 | 0.000 | 0.182 | 0.737 | 0.000 | ||
| 1 spectrum, DCPPADPVIK | 0.000 | 0.000 | 0.000 | 0.000 | 0.000 | 0.000 | 0.785 | 0.215 | ||
| 3 spectra, VEAAVGK | 0.000 | 0.000 | 0.075 | 0.000 | 0.000 | 0.000 | 0.861 | 0.063 | ||
| 4 spectra, AIYIFAK | 0.000 | 0.000 | 0.000 | 0.013 | 0.060 | 0.000 | 0.899 | 0.028 |
| Plot | Mito | Lyso or Perox | ER | Golgi | PM | Cytosol | Nucleus | ||||||
| Expt B |
3 peptides |
7 spectra |
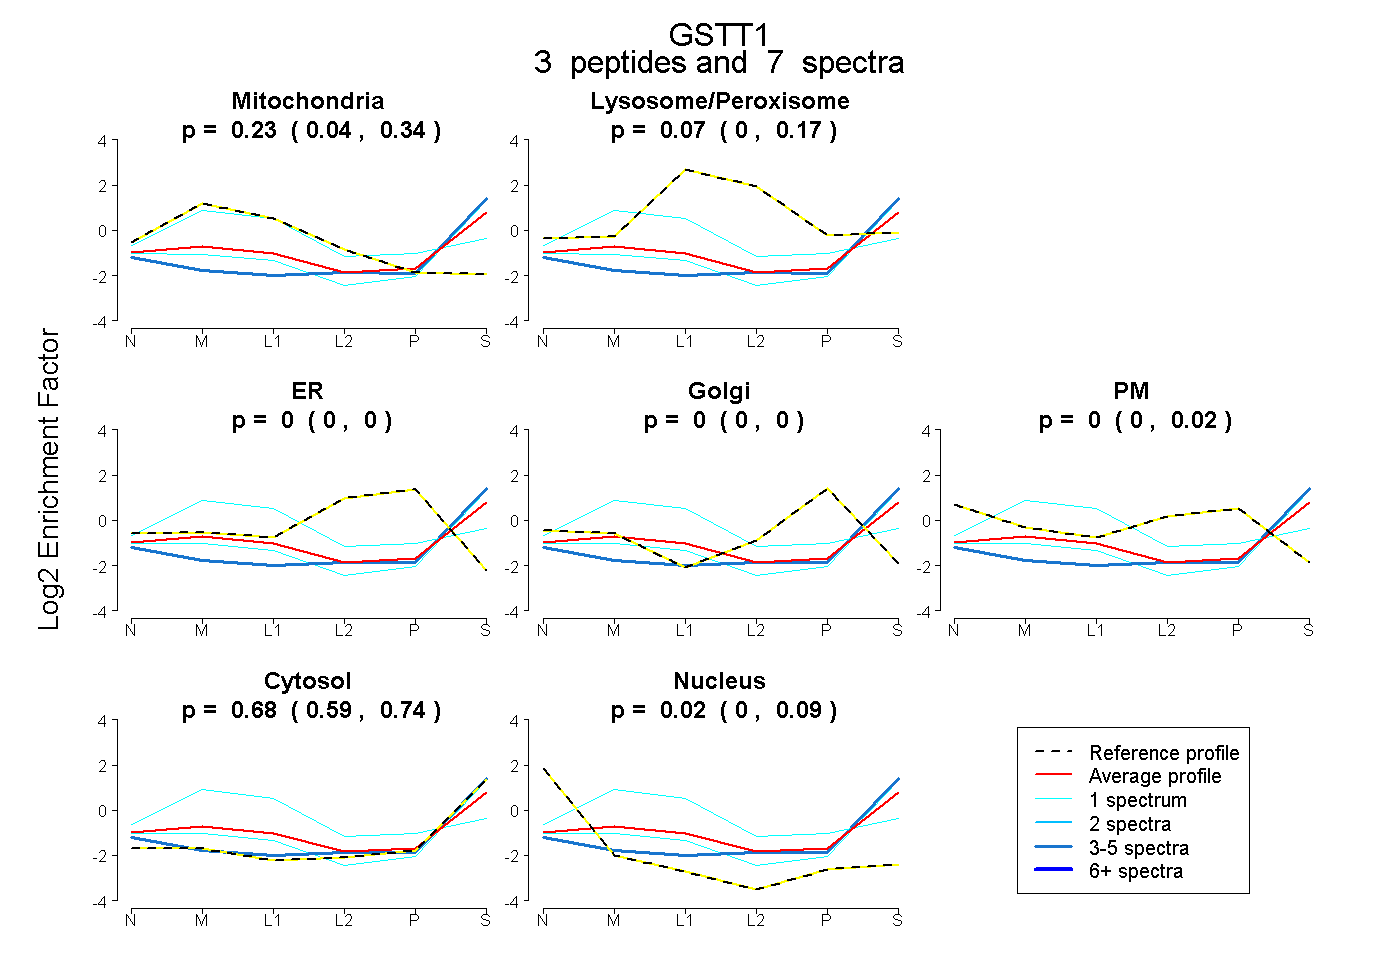 |
0.229 0.040 | 0.342 |
0.072 0.000 | 0.165 |
0.000 0.000 | 0.000 |
0.000 0.000 | 0.000 |
0.000 0.000 | 0.019 |
0.681 0.592 | 0.744 |
0.017 0.000 | 0.092 |
|||
| Plot | Lyso | Other | |||||||||||
| Expt C |
8 peptides |
44 spectra |
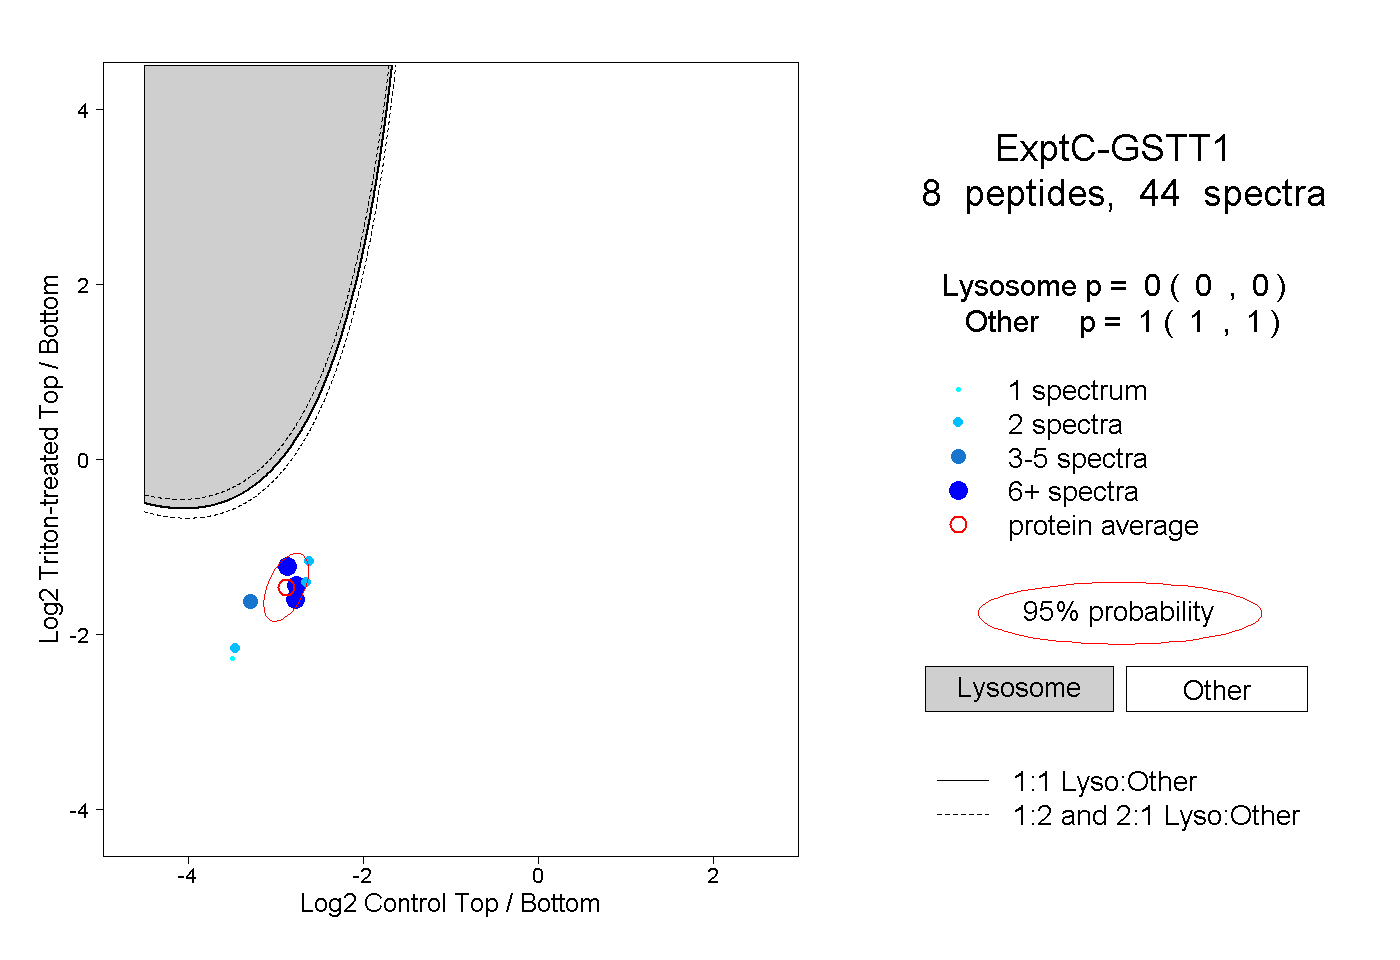 |
0.000 0.000 | 0.000 |
1.000 1.000 | 1.000 |
||||||||
| Plot | Lyso | Other | |||||||||||
| Expt D |
1 peptide |
1 spectrum |
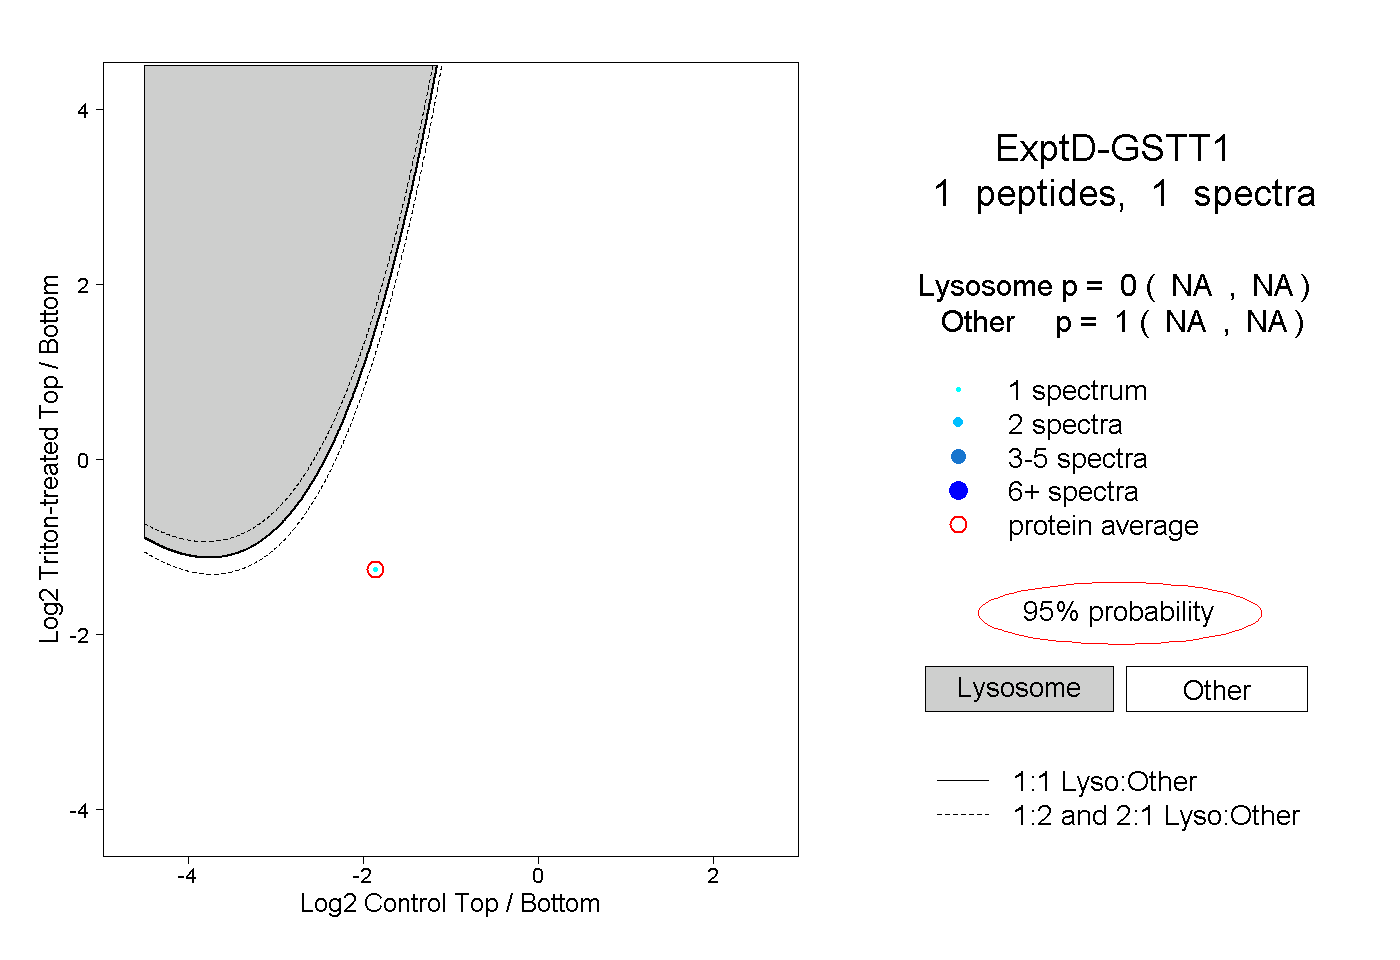 |
0.000 NA | NA |
1.000 NA | NA |