 3
3peptides
spectra
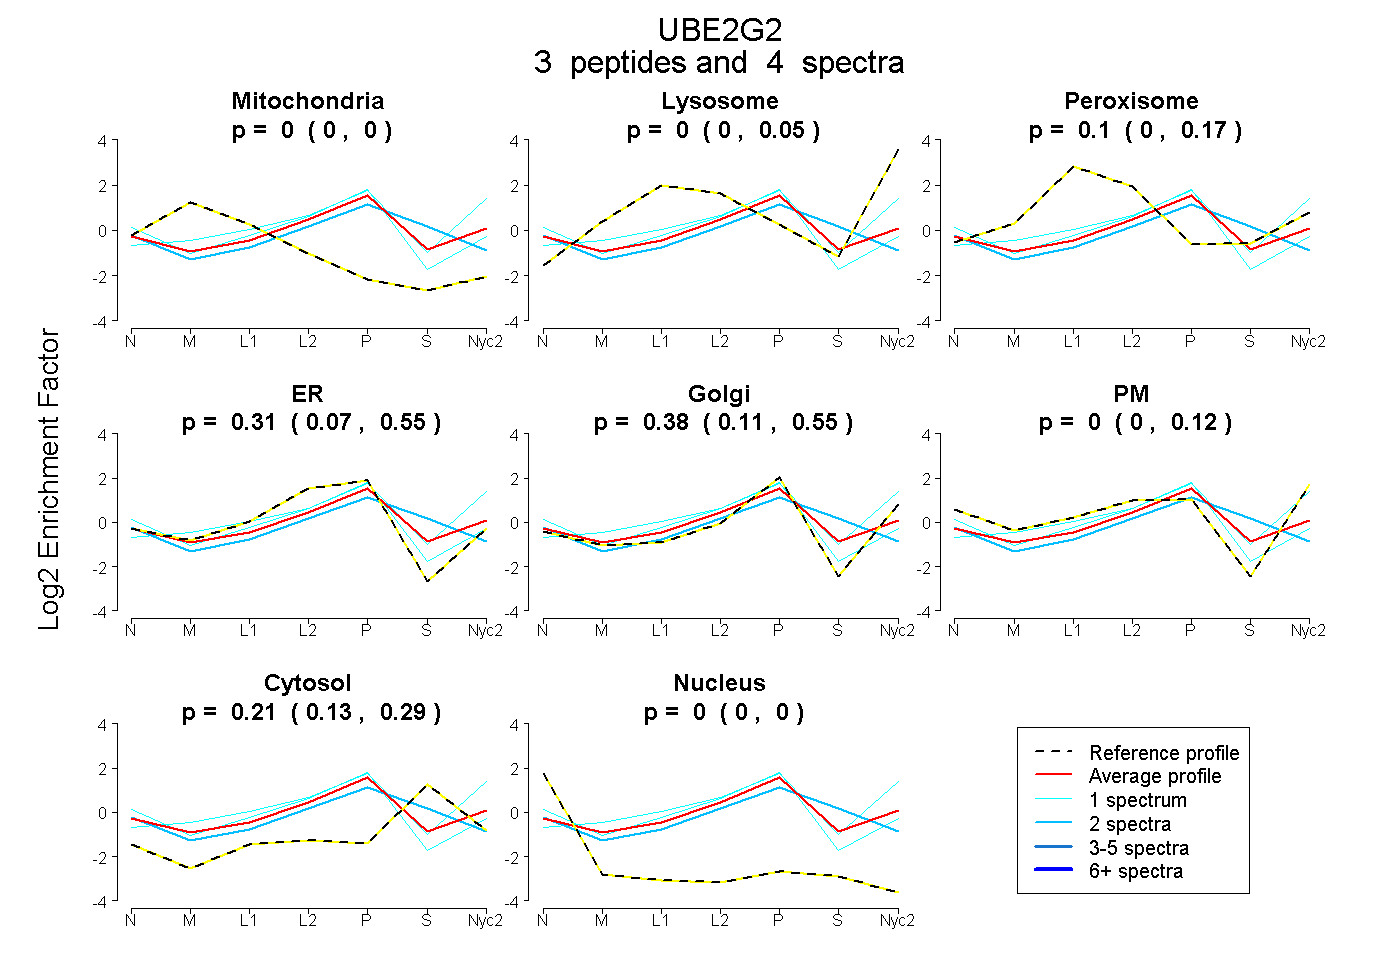
0.000 | 0.000
0.000 | 0.050
0.000 | 0.166
0.065 | 0.549
0.107 | 0.553
0.000 | 0.118
0.135 | 0.290
0.000 | 0.000
1peptide
spectra
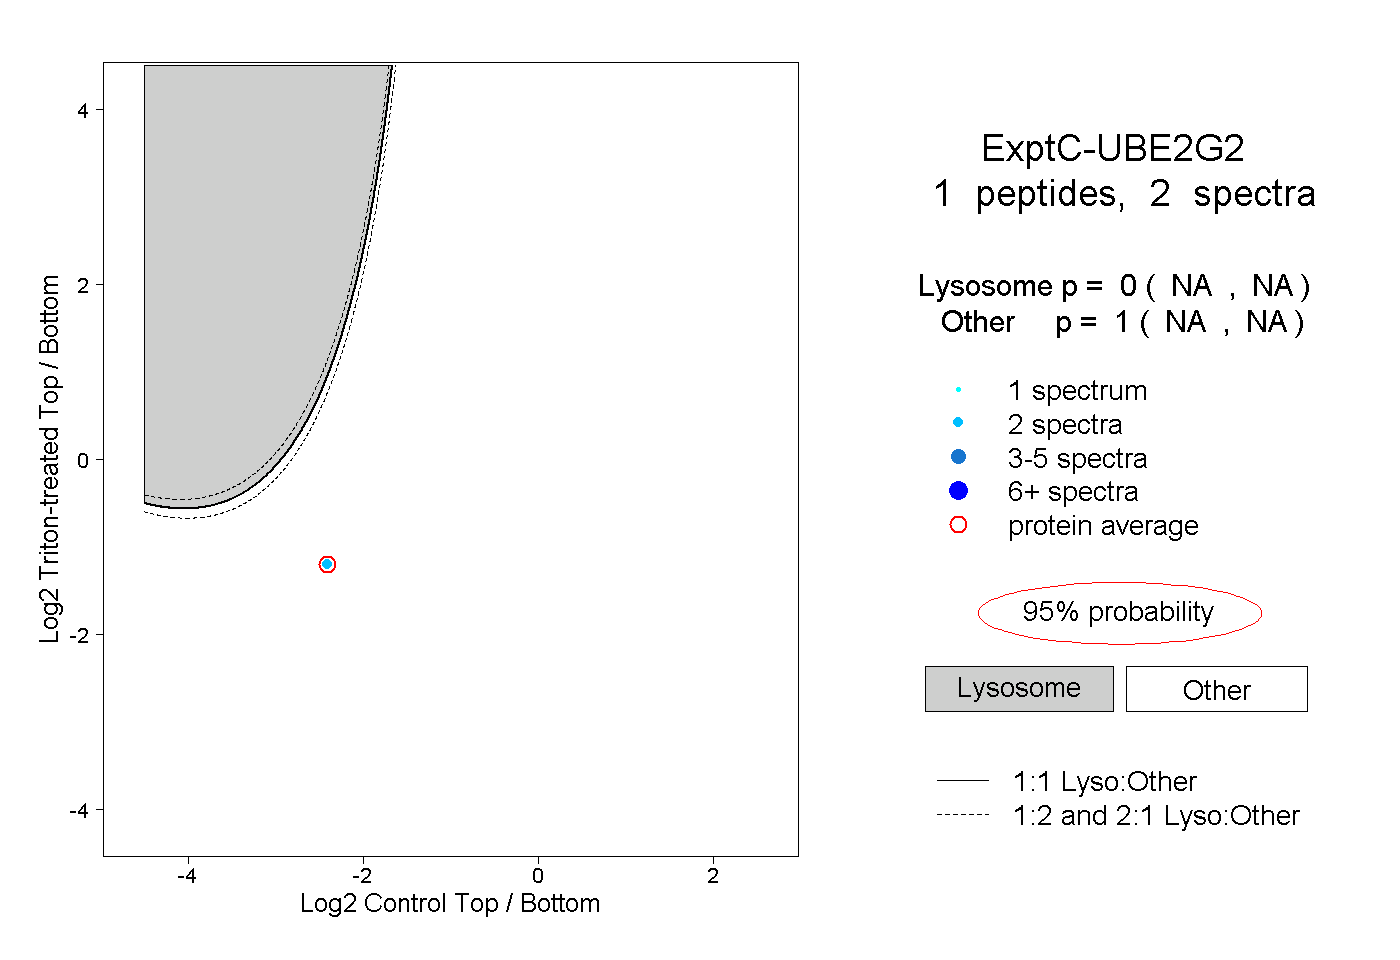
NA | NA
NA | NA
| Plot | Mito | Lyso | Perox | ER | Golgi | PM | Cytosol | Nucleus | |||||
| Expt A |
3 peptides |
4 spectra |
|
0.000 0.000 | 0.000 |
0.000 0.000 | 0.050 |
0.096 0.000 | 0.166 |
0.307 0.065 | 0.549 |
0.385 0.107 | 0.553 |
0.000 0.000 | 0.118 |
0.212 0.135 | 0.290 |
0.000 0.000 | 0.000 |
||
| Plot | Lyso | Other | |||||||||||
| Expt C |
1 peptide |
2 spectra |
|
0.000 NA | NA |
1.000 NA | NA |