9
9peptides
spectra
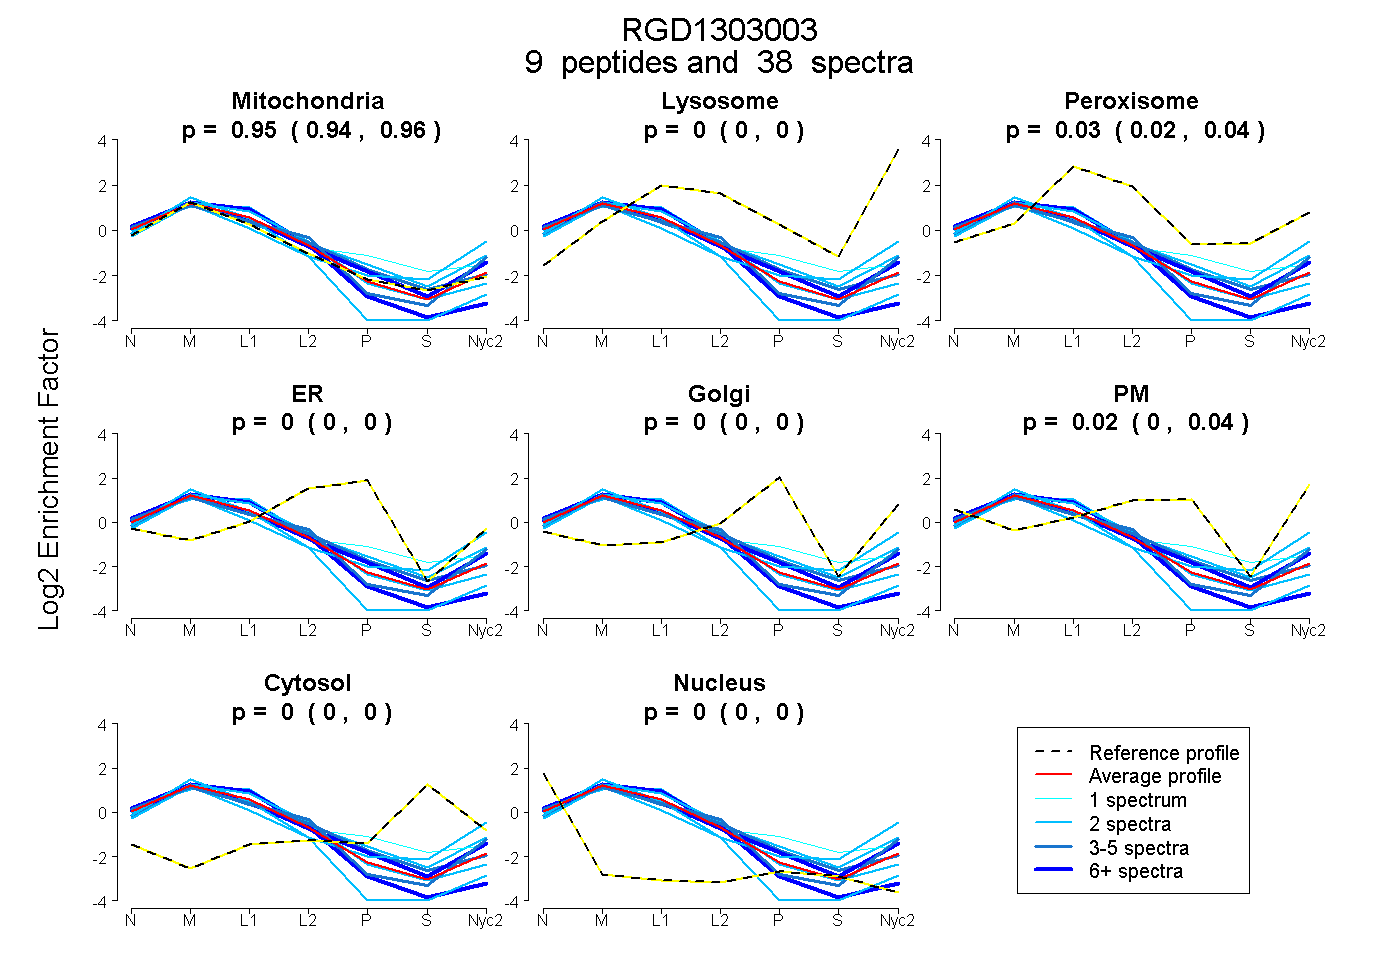
0.937 | 0.963
0.000 | 0.000
0.015 | 0.038
0.000 | 0.000
0.000 | 0.000
0.004 | 0.036
0.000 | 0.000
0.000 | 0.000
10peptides
spectra
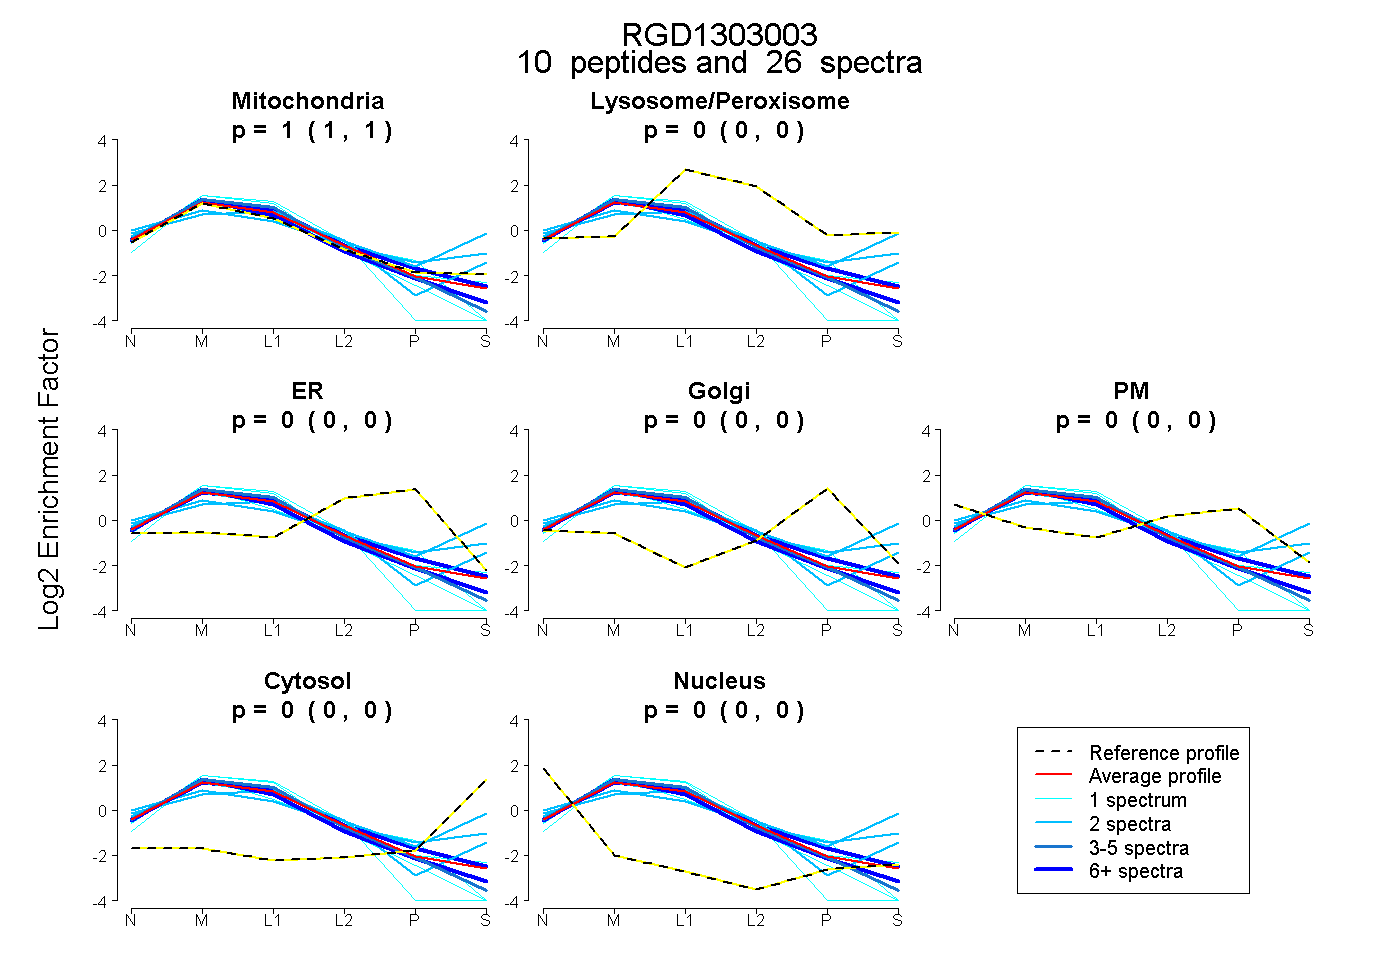
1.000 | 1.000
0.000 | 0.000
0.000 | 0.000
0.000 | 0.000
0.000 | 0.000
0.000 | 0.000
0.000 | 0.000
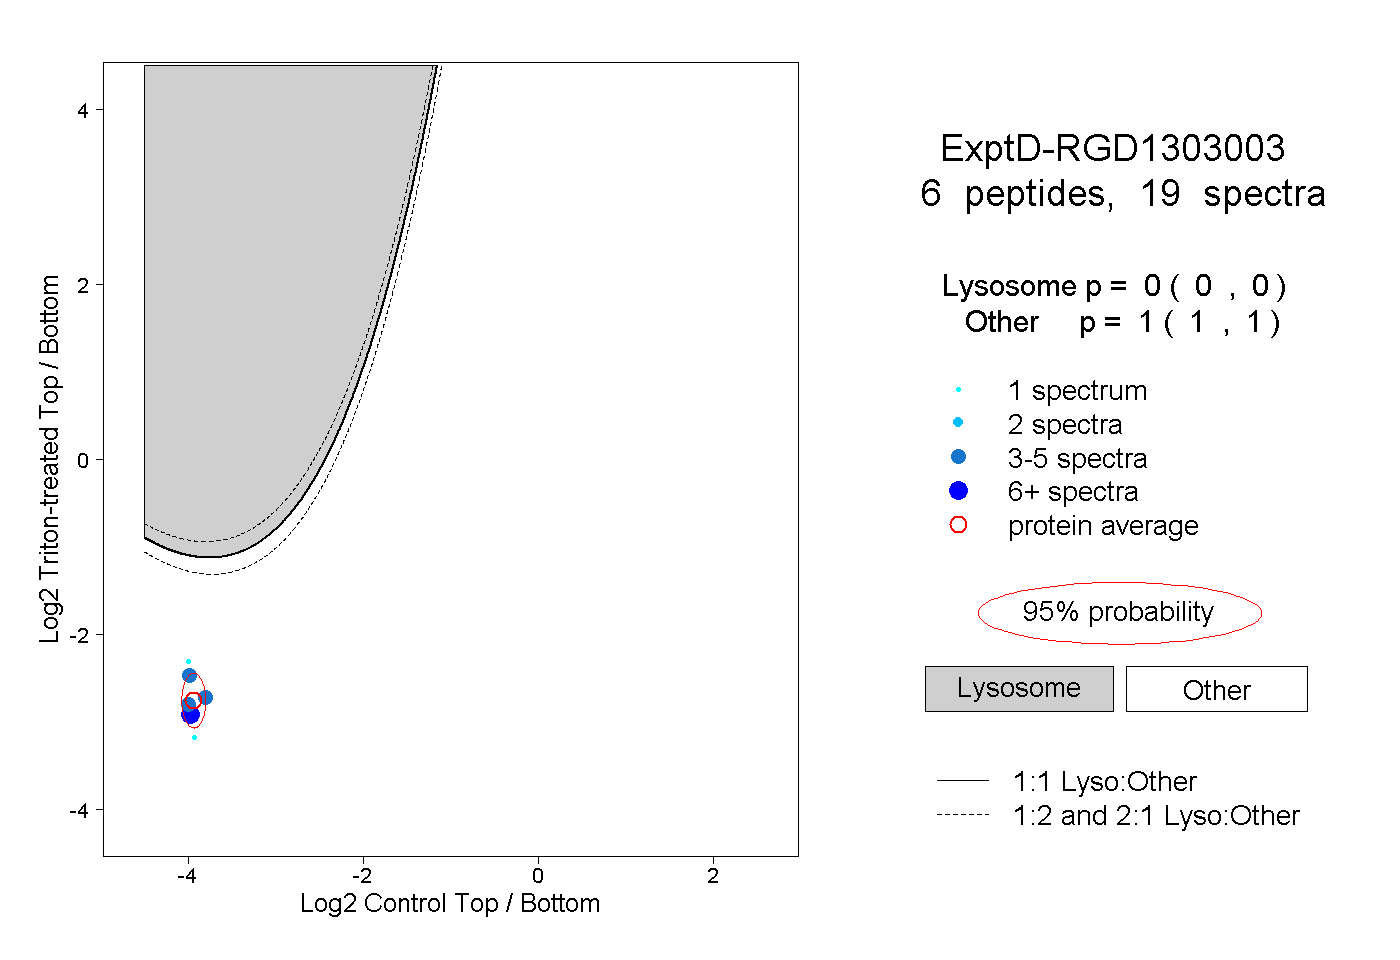
12peptides
spectra
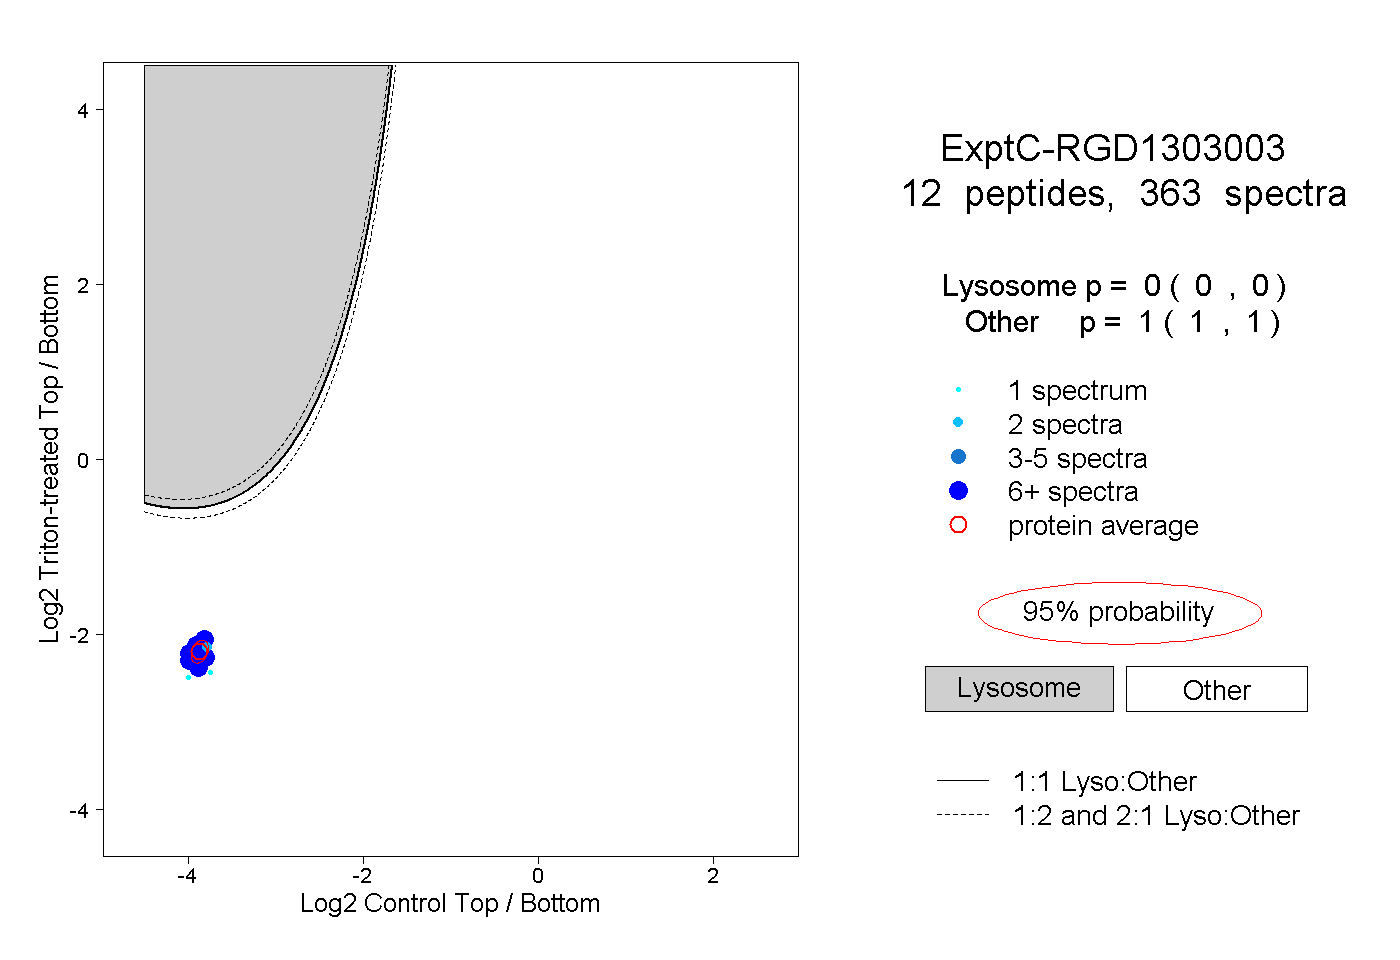
0.000 | 0.000
1.000 | 1.000