 9
9peptides
spectra
0.937 | 0.963
0.000 | 0.000
0.015 | 0.038
0.000 | 0.000
0.000 | 0.000
0.004 | 0.036
0.000 | 0.000
0.000 | 0.000
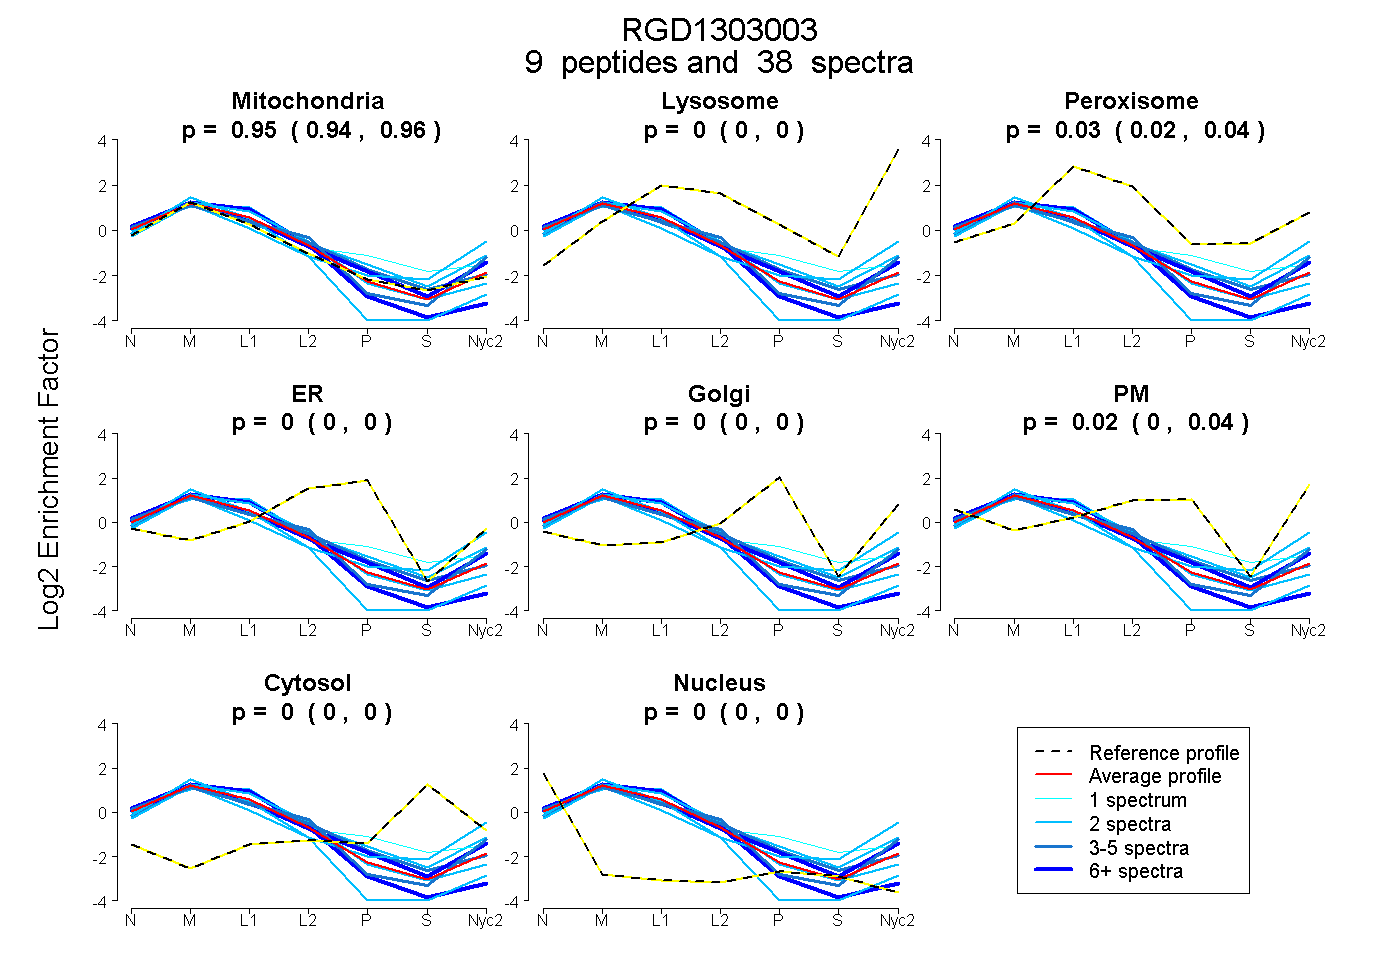
| Plot | Mito | Lyso | Perox | ER | Golgi | PM | Cytosol | Nucleus | |||||
| Expt A |
9 peptides |
38 spectra |
|
0.951 0.937 | 0.963 |
0.000 0.000 | 0.000 |
0.028 0.015 | 0.038 |
0.000 0.000 | 0.000 |
0.000 0.000 | 0.000 |
0.021 0.004 | 0.036 |
0.000 0.000 | 0.000 |
0.000 0.000 | 0.000 |
| 1 spectrum, GVTEAHVDQK | 0.728 | 0.000 | 0.123 | 0.000 | 0.115 | 0.000 | 0.034 | 0.000 | ||
| 5 spectra, NLSTFAVDGK | 0.883 | 0.000 | 0.032 | 0.085 | 0.000 | 0.000 | 0.000 | 0.000 | ||
| 2 spectra, KPIGLCCIAPVLAAK | 0.969 | 0.000 | 0.031 | 0.000 | 0.000 | 0.000 | 0.000 | 0.000 | ||
| 2 spectra, VLVSPR | 0.717 | 0.205 | 0.000 | 0.000 | 0.000 | 0.000 | 0.012 | 0.066 | ||
| 8 spectra, GGAEVHIFAPDVPQMHVIDHTK | 0.991 | 0.000 | 0.000 | 0.000 | 0.000 | 0.000 | 0.000 | 0.009 | ||
| 4 spectra, VVTTPAFMCETELHHIHDGIGAMVK | 0.913 | 0.043 | 0.000 | 0.000 | 0.000 | 0.045 | 0.000 | 0.000 | ||
| 2 spectra, EFHGAK | 0.735 | 0.000 | 0.146 | 0.000 | 0.000 | 0.119 | 0.000 | 0.000 | ||
| 2 spectra, VLELTGK | 0.968 | 0.000 | 0.000 | 0.000 | 0.000 | 0.000 | 0.000 | 0.032 | ||
| 12 spectra, NVLAESAR | 0.857 | 0.000 | 0.000 | 0.000 | 0.000 | 0.143 | 0.000 | 0.000 |
| Plot | Mito | Lyso or Perox | ER | Golgi | PM | Cytosol | Nucleus | ||||||
| Expt B |
10 peptides |
26 spectra |
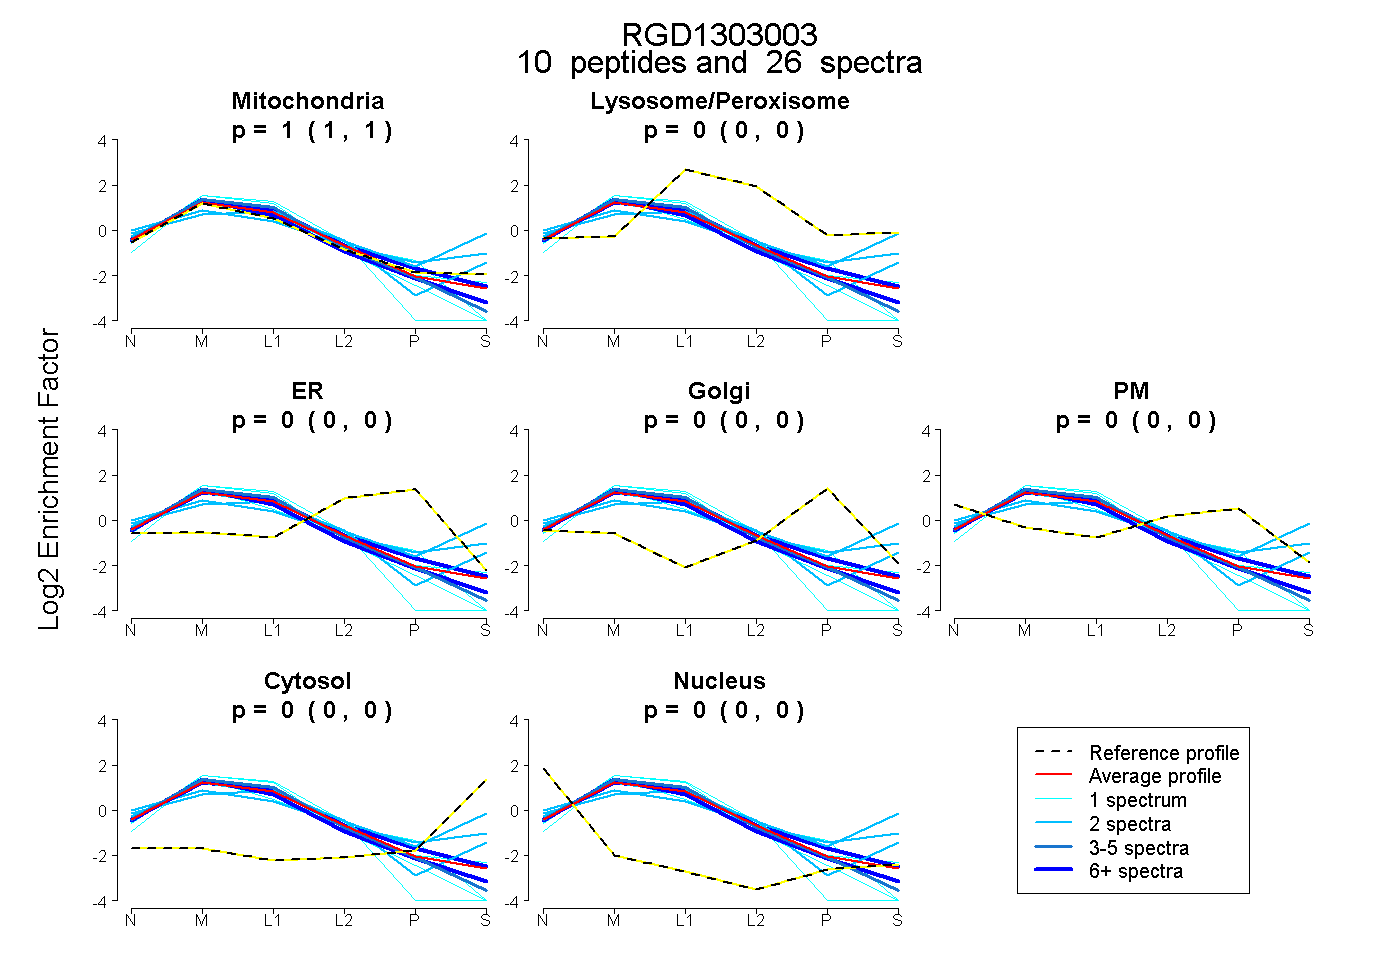 |
1.000 1.000 | 1.000 |
0.000 0.000 | 0.000 |
0.000 0.000 | 0.000 |
0.000 0.000 | 0.000 |
0.000 0.000 | 0.000 |
0.000 0.000 | 0.000 |
0.000 0.000 | 0.000 |
|||
| Plot | Lyso | Other | |||||||||||
| Expt C |
12 peptides |
363 spectra |
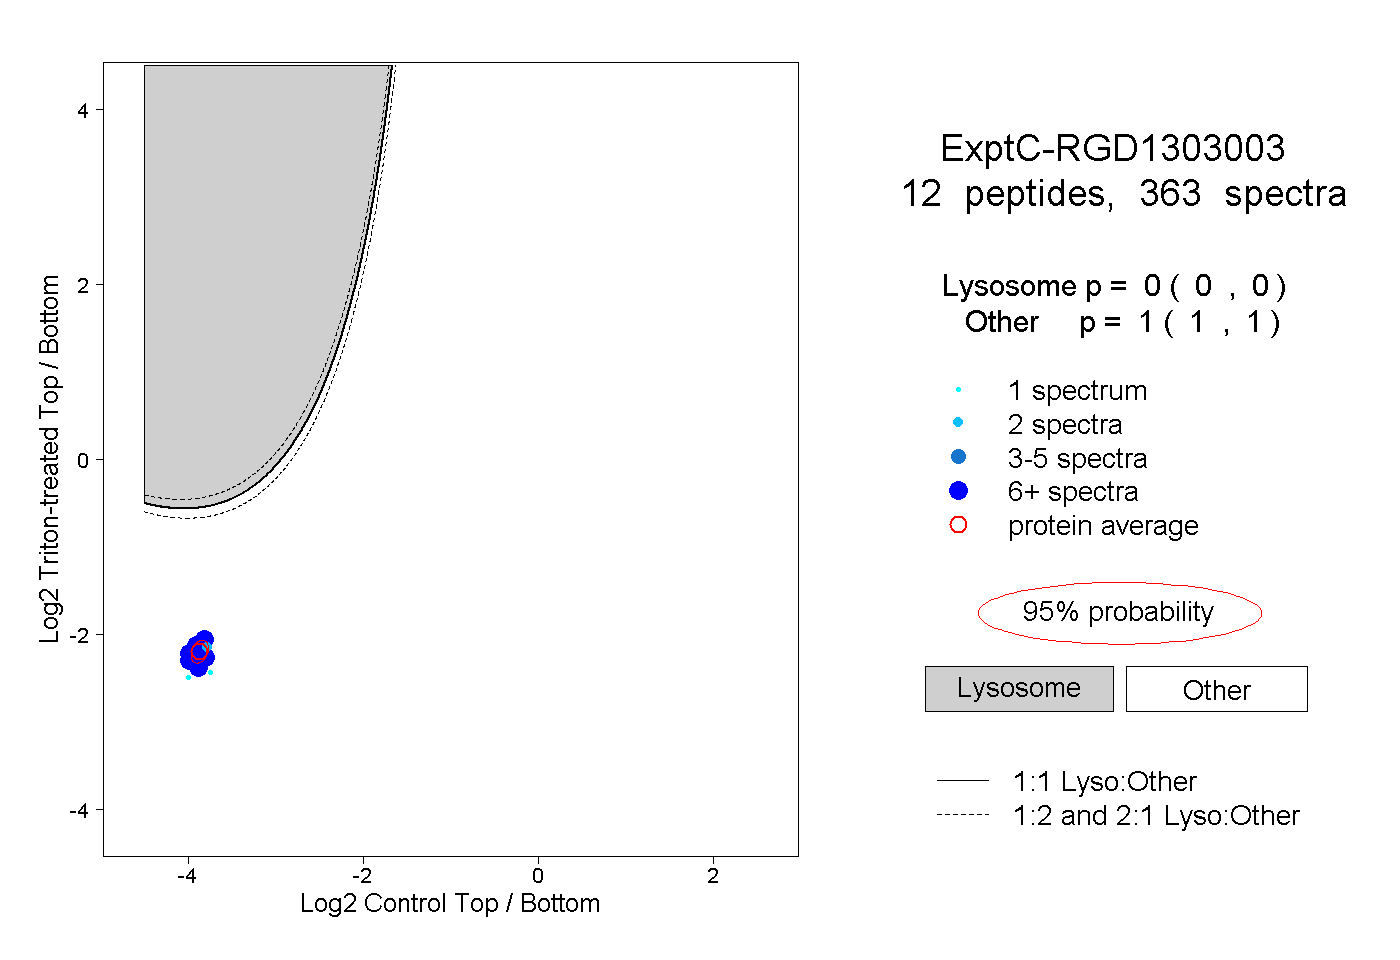 |
0.000 0.000 | 0.000 |
1.000 1.000 | 1.000 |
||||||||
| Plot | Lyso | Other | |||||||||||
| Expt D |
6 peptides |
19 spectra |
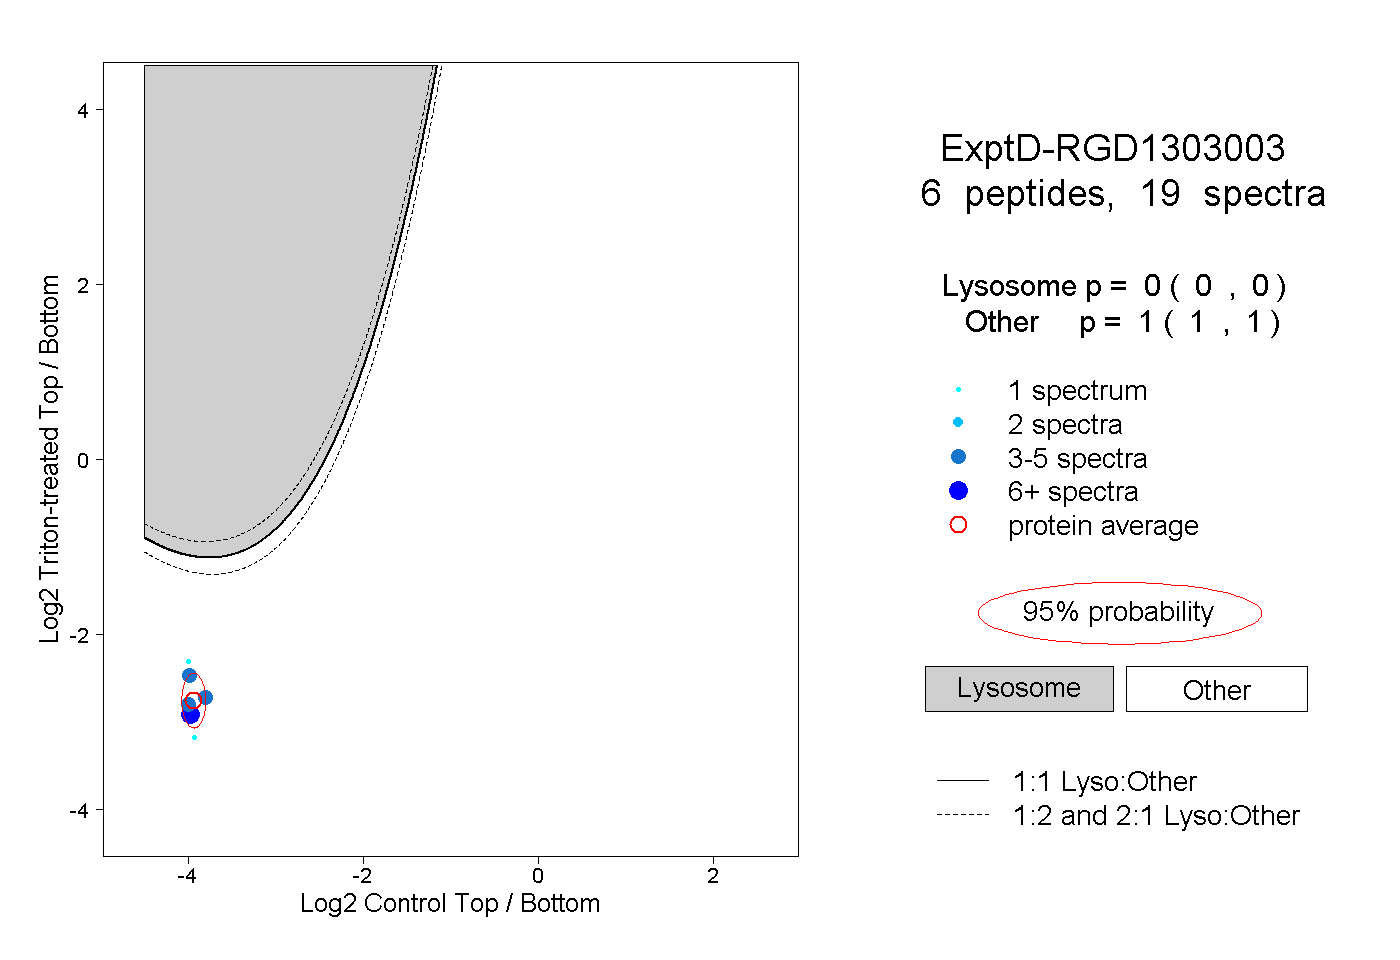 |
0.000 0.000 | 0.000 |
1.000 1.000 | 1.000 |