AGPAT3
[ENSRNOP00000001602]
Main page
| | | Plot |
Mito |
Lyso |
|
Perox |
ER |
Golgi |
PM |
Cytosol |
Nucleus |
|
| Expt A |
 7
7
peptides |
24
spectra |
 |
0.000
0.000 | 0.000 |
0.000
0.000 | 0.000 |
|
0.000
0.000 | 0.000 |
0.798
0.768 | 0.820 |
0.092
0.062 | 0.121 |
0.000
0.000 | 0.000 |
0.000
0.000 | 0.000 |
0.110
0.102 | 0.116 |
|
| | | Plot |
Mito |
|
Lyso or Perox |
|
ER |
Golgi |
PM |
Cytosol |
Nucleus |
|
| Expt B |
2
peptides |
3
spectra |
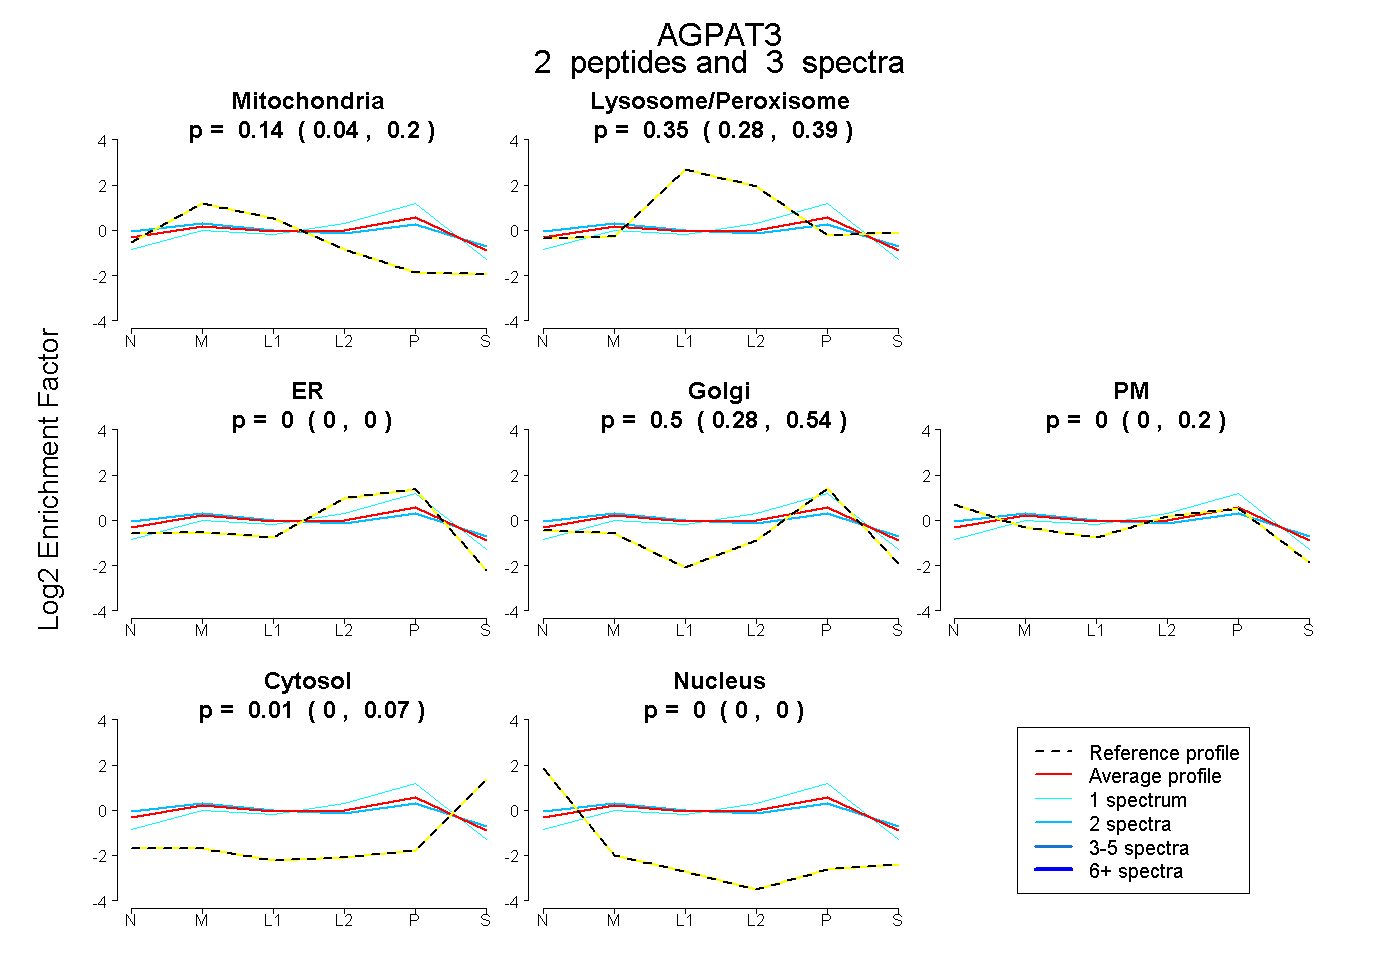 |
0.136
0.044 | 0.199 |
|
0.355
0.275 | 0.390 |
|
0.000
0.000 | 0.000 |
0.503
0.284 | 0.542 |
0.000
0.000 | 0.197 |
0.007
0.000 | 0.069 |
0.000
0.000 | 0.000 |
|
| 1 spectrum, YHLLPR |
0.016 |
|
0.310 |
|
0.216 |
0.458 |
0.000 |
0.000 |
0.000 |
|
| 2 spectra, GFTTAVQCLR |
0.168 |
|
0.293 |
|
0.000 |
0.285 |
0.186 |
0.068 |
0.000 |
|
| | | Plot |
|
Lyso |
|
|
|
|
|
|
|
Other |
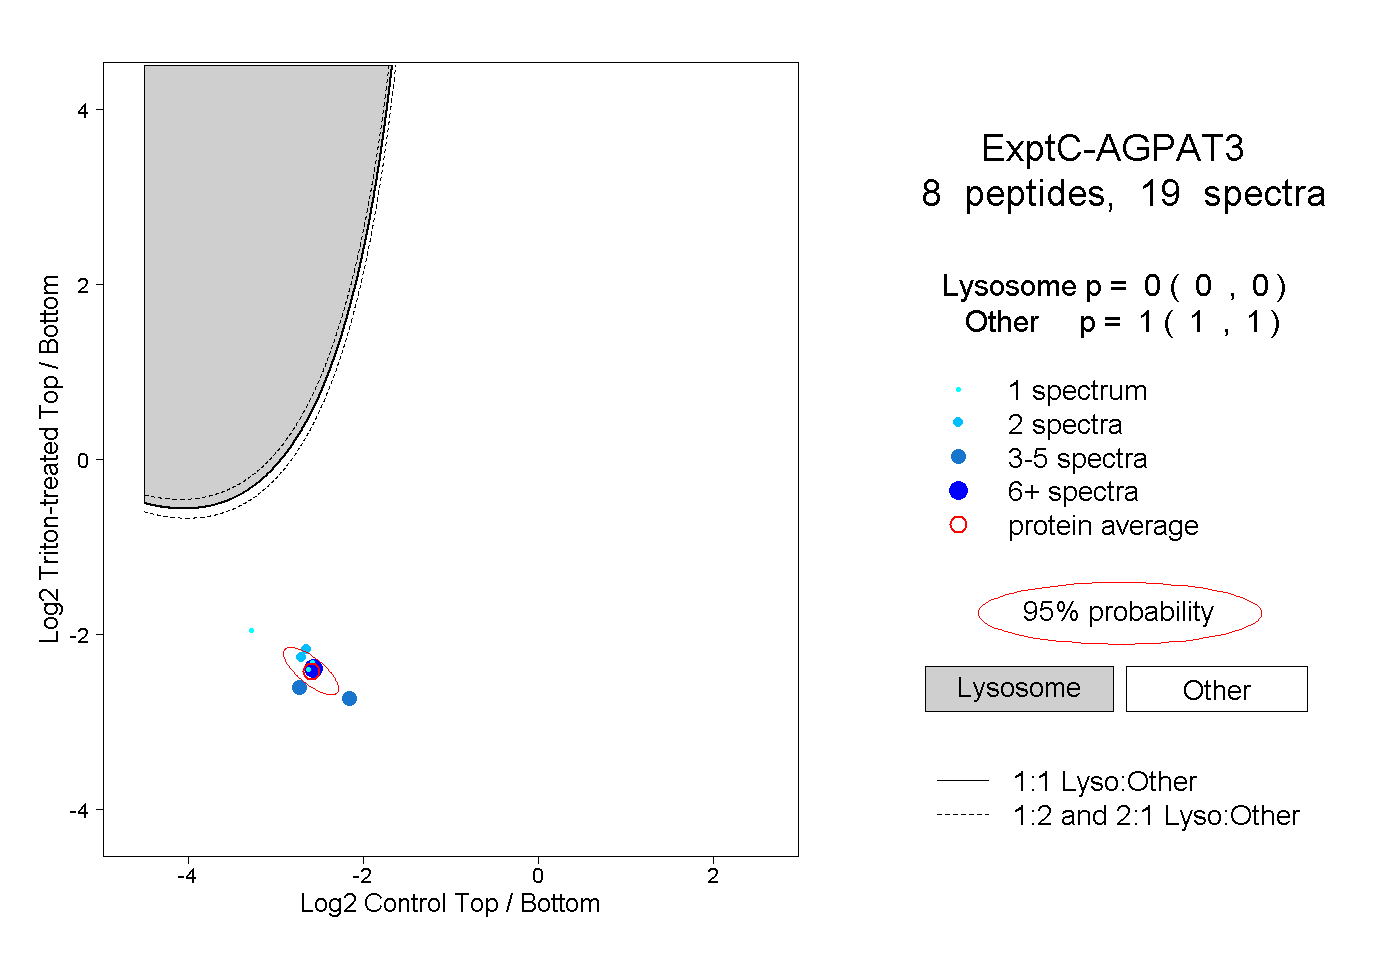
| Expt C |
8
peptides |
19
spectra |
 |
|
0.000
0.000 | 0.000 |
|
|
|
|
|
|
|
1.000
1.000 | 1.000 |