 7
7peptides
spectra

0.000 | 0.000
0.000 | 0.000
0.000 | 0.000
0.768 | 0.820
0.062 | 0.121
0.000 | 0.000
0.000 | 0.000
0.102 | 0.116
2peptides
spectra
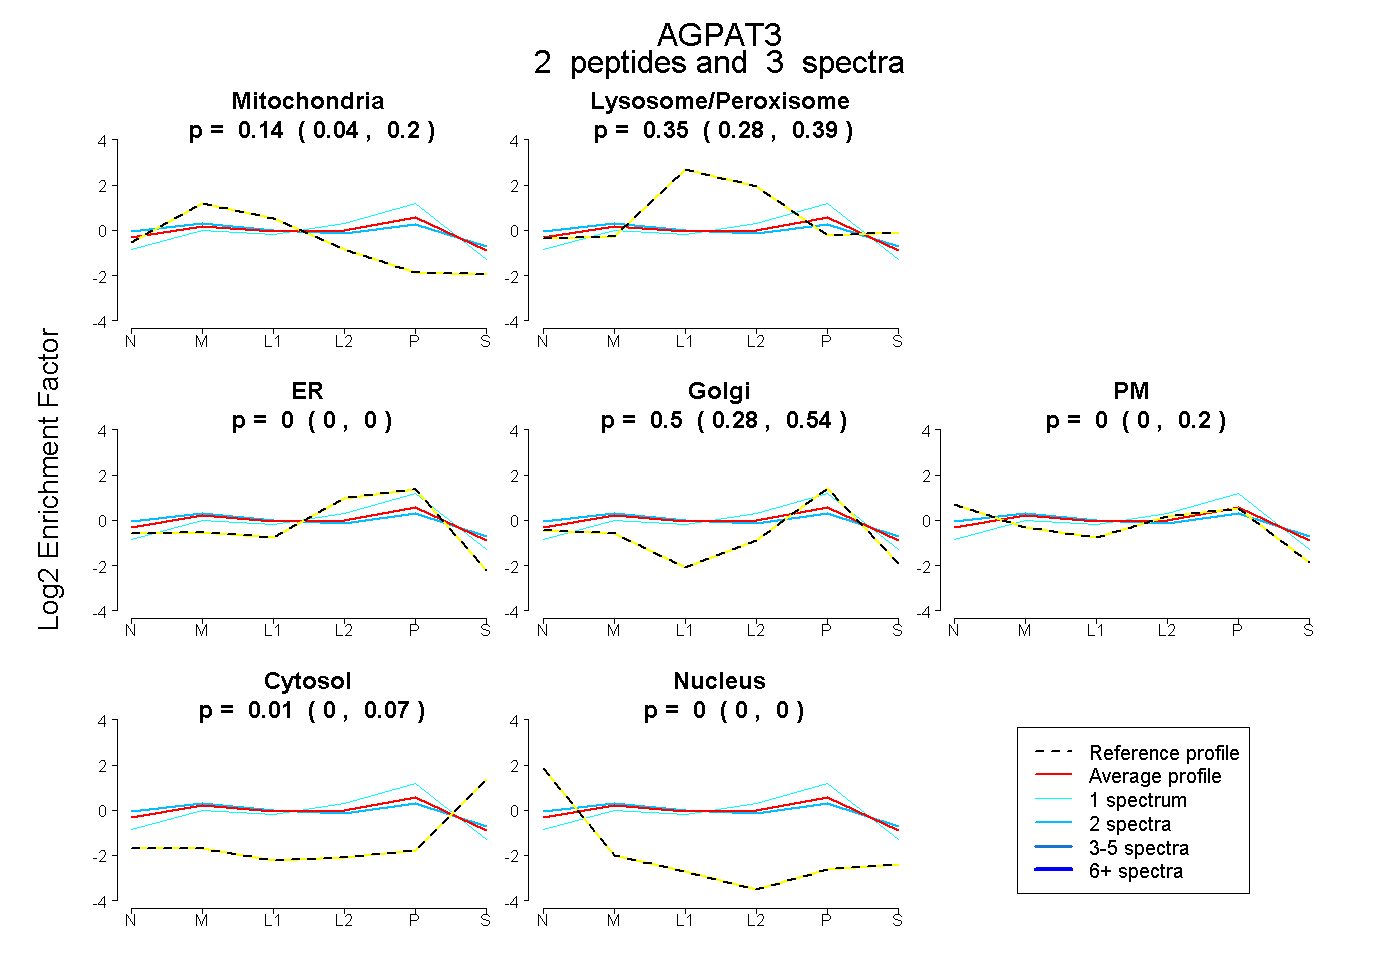
0.044 | 0.199
0.275 | 0.390
0.000 | 0.000
0.284 | 0.542
0.000 | 0.197
0.000 | 0.069
0.000 | 0.000
8peptides
spectra
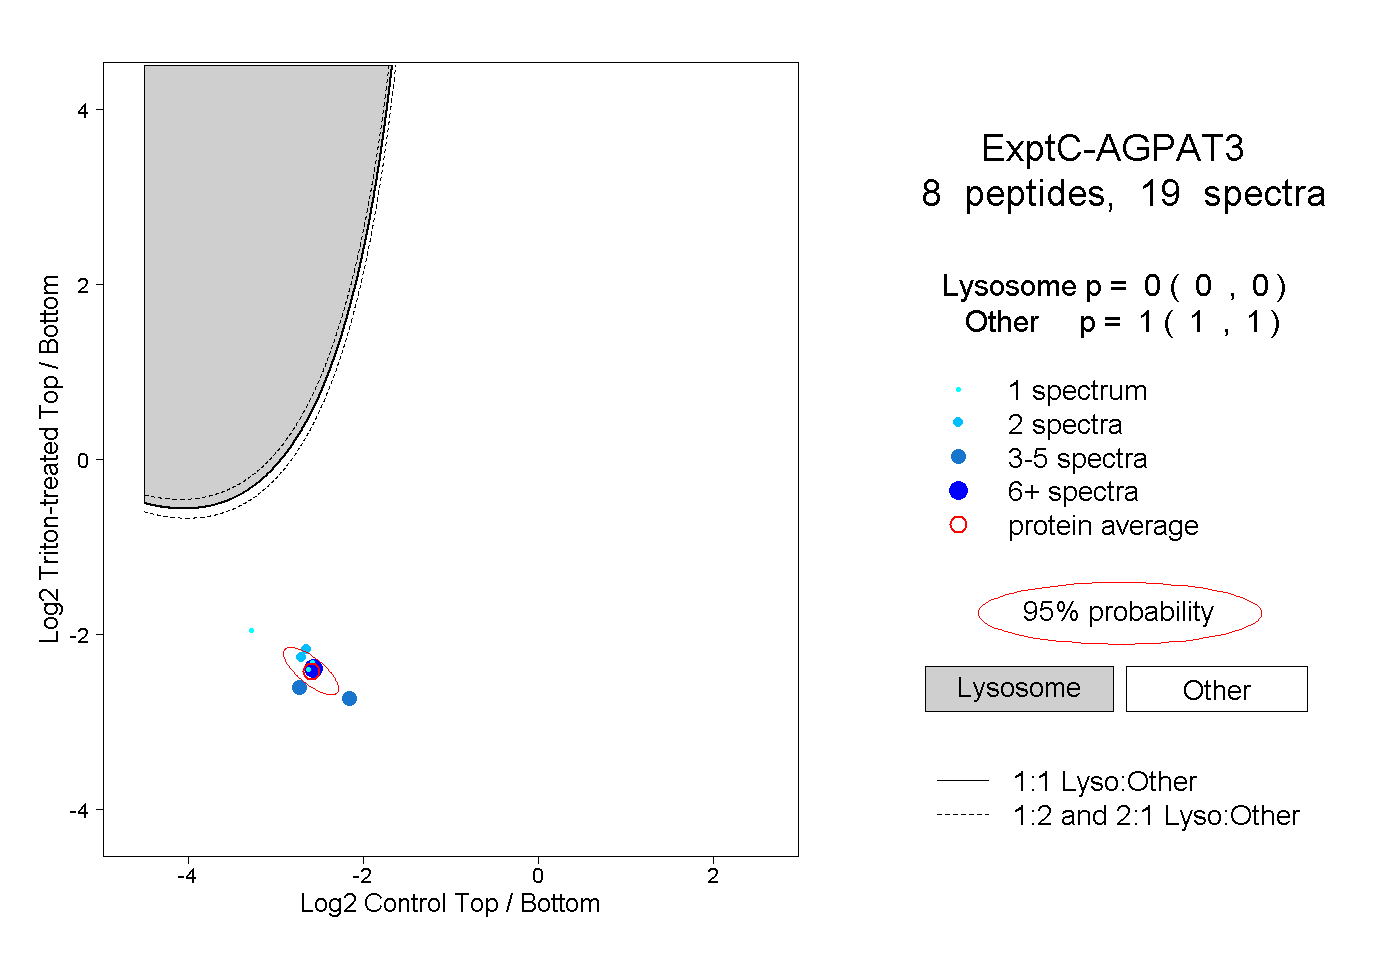
0.000 | 0.000
1.000 | 1.000