 4
4peptides
spectra
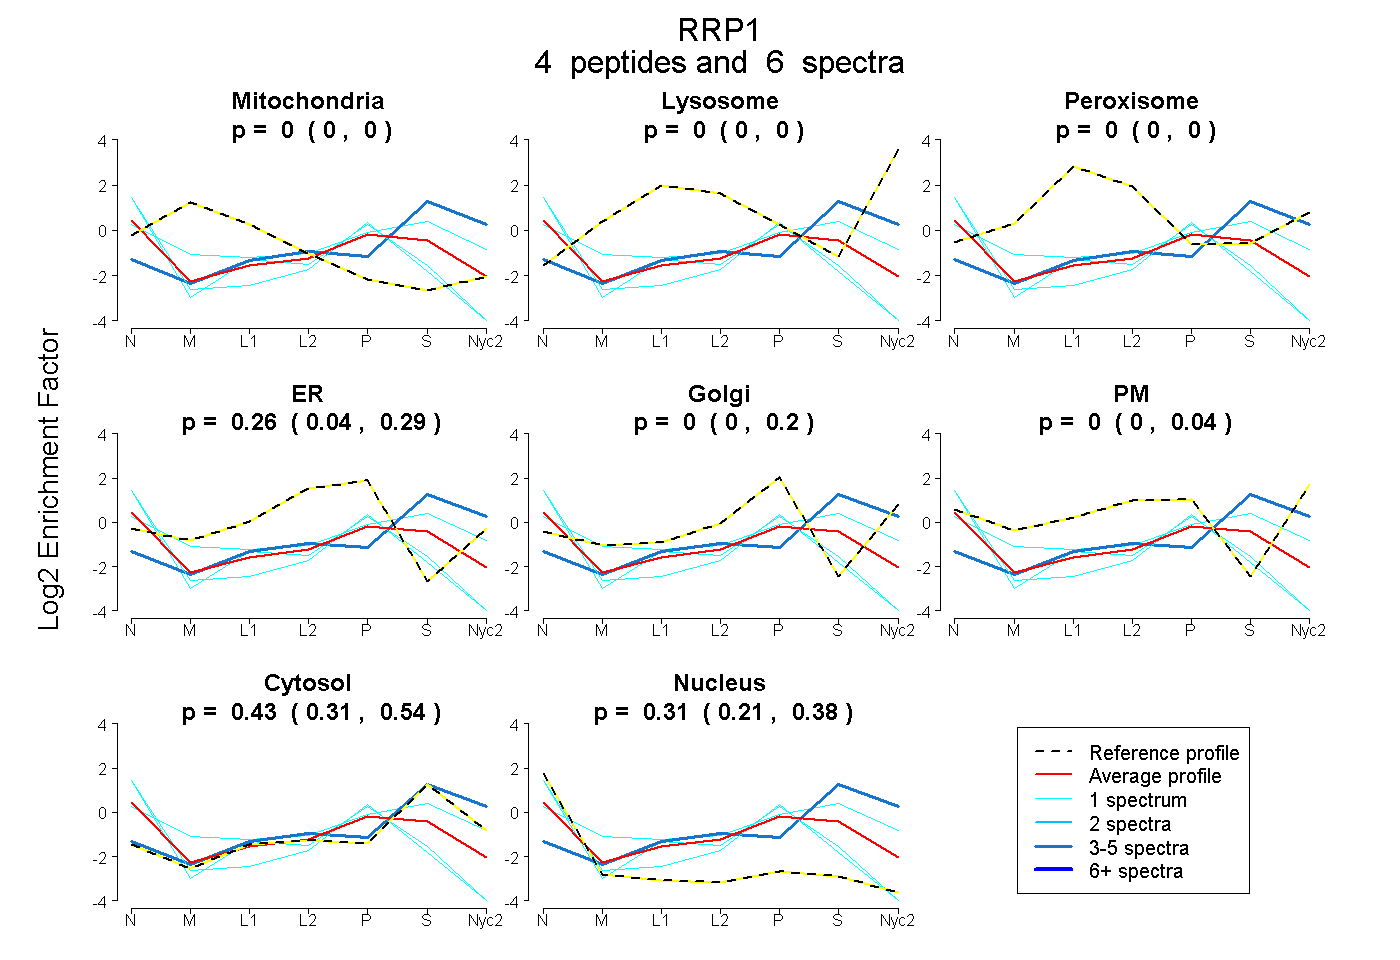
0.000 | 0.000
0.000 | 0.000
0.000 | 0.000
0.036 | 0.291
0.000 | 0.199
0.000 | 0.039
0.312 | 0.536
0.214 | 0.380
| Plot | Mito | Lyso | Perox | ER | Golgi | PM | Cytosol | Nucleus | |||||
| Expt A |
4 peptides |
6 spectra |
|
0.000 0.000 | 0.000 |
0.000 0.000 | 0.000 |
0.000 0.000 | 0.000 |
0.258 0.036 | 0.291 |
0.000 0.000 | 0.199 |
0.000 0.000 | 0.039 |
0.431 0.312 | 0.536 |
0.311 0.214 | 0.380 |
| 1 spectrum, QSTPSQNR | 0.000 | 0.000 | 0.000 | 0.300 | 0.000 | 0.000 | 0.019 | 0.682 | ||
| 1 spectrum, DLAGGIFPEDDVPEK | 0.062 | 0.000 | 0.000 | 0.000 | 0.095 | 0.203 | 0.559 | 0.081 | ||
| 1 spectrum, ATGGFTPEELLK | 0.000 | 0.000 | 0.000 | 0.322 | 0.000 | 0.000 | 0.075 | 0.603 | ||
| 3 spectra, LLEGR | 0.000 | 0.128 | 0.000 | 0.000 | 0.000 | 0.000 | 0.872 | 0.000 |