 4
4peptides
spectra
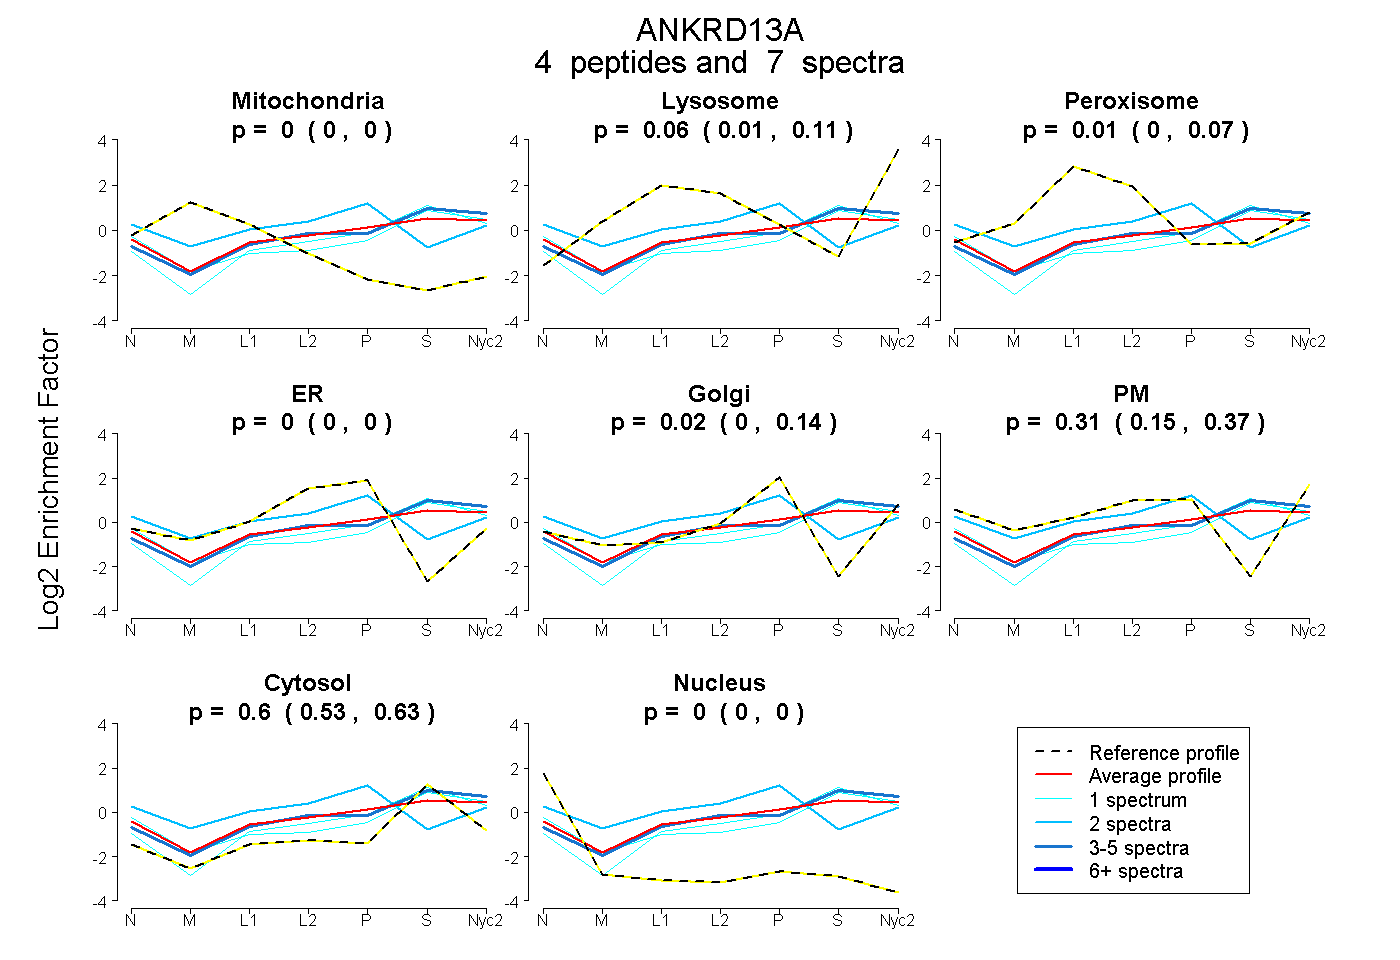
0.000 | 0.000
0.010 | 0.107
0.000 | 0.067
0.000 | 0.001
0.000 | 0.139
0.153 | 0.371
0.533 | 0.627
0.000 | 0.000
| Plot | Mito | Lyso | Perox | ER | Golgi | PM | Cytosol | Nucleus | |||||
| Expt A |
4 peptides |
7 spectra |
|
0.000 0.000 | 0.000 |
0.064 0.010 | 0.107 |
0.012 0.000 | 0.067 |
0.000 0.000 | 0.001 |
0.015 0.000 | 0.139 |
0.314 0.153 | 0.371 |
0.595 0.533 | 0.627 |
0.000 0.000 | 0.000 |
| 1 spectrum, SGFWGWR | 0.000 | 0.025 | 0.000 | 0.000 | 0.000 | 0.267 | 0.707 | 0.000 | ||
| 1 spectrum, CPGGLSDSSR | 0.000 | 0.111 | 0.000 | 0.000 | 0.140 | 0.000 | 0.749 | 0.000 | ||
| 3 spectra, TEHLTEEEK | 0.000 | 0.190 | 0.000 | 0.000 | 0.000 | 0.153 | 0.657 | 0.000 | ||
| 2 spectra, NVAFER | 0.000 | 0.000 | 0.136 | 0.216 | 0.189 | 0.241 | 0.218 | 0.000 |
| Plot | Lyso | Other | |||||||||||
| Expt C |
3 peptides |
7 spectra |
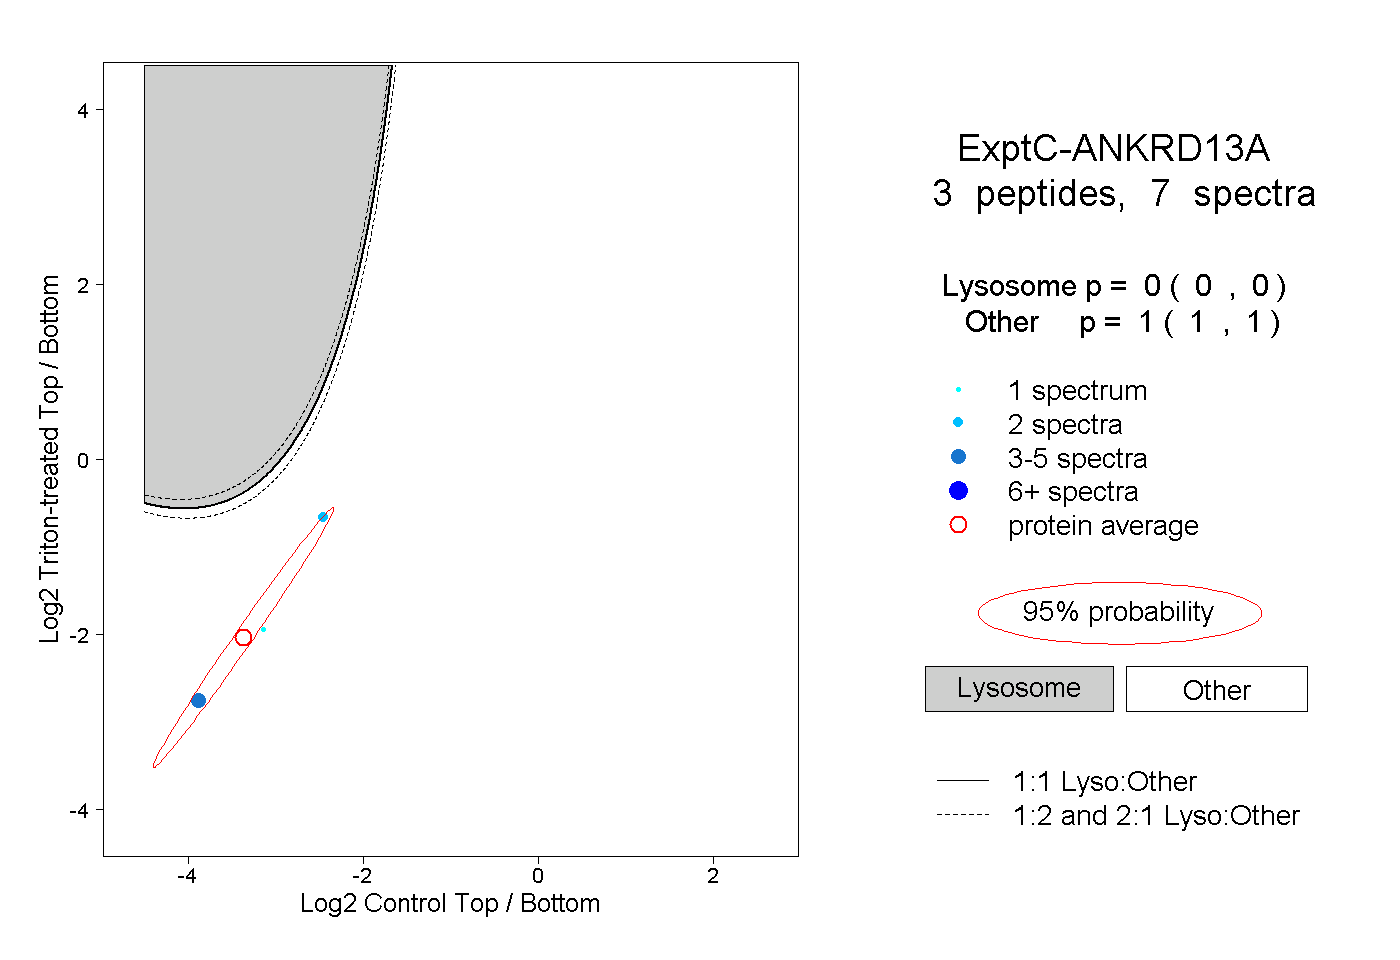 |
0.000 0.000 | 0.000 |
1.000 1.000 | 1.000 |