18
18peptides
spectra
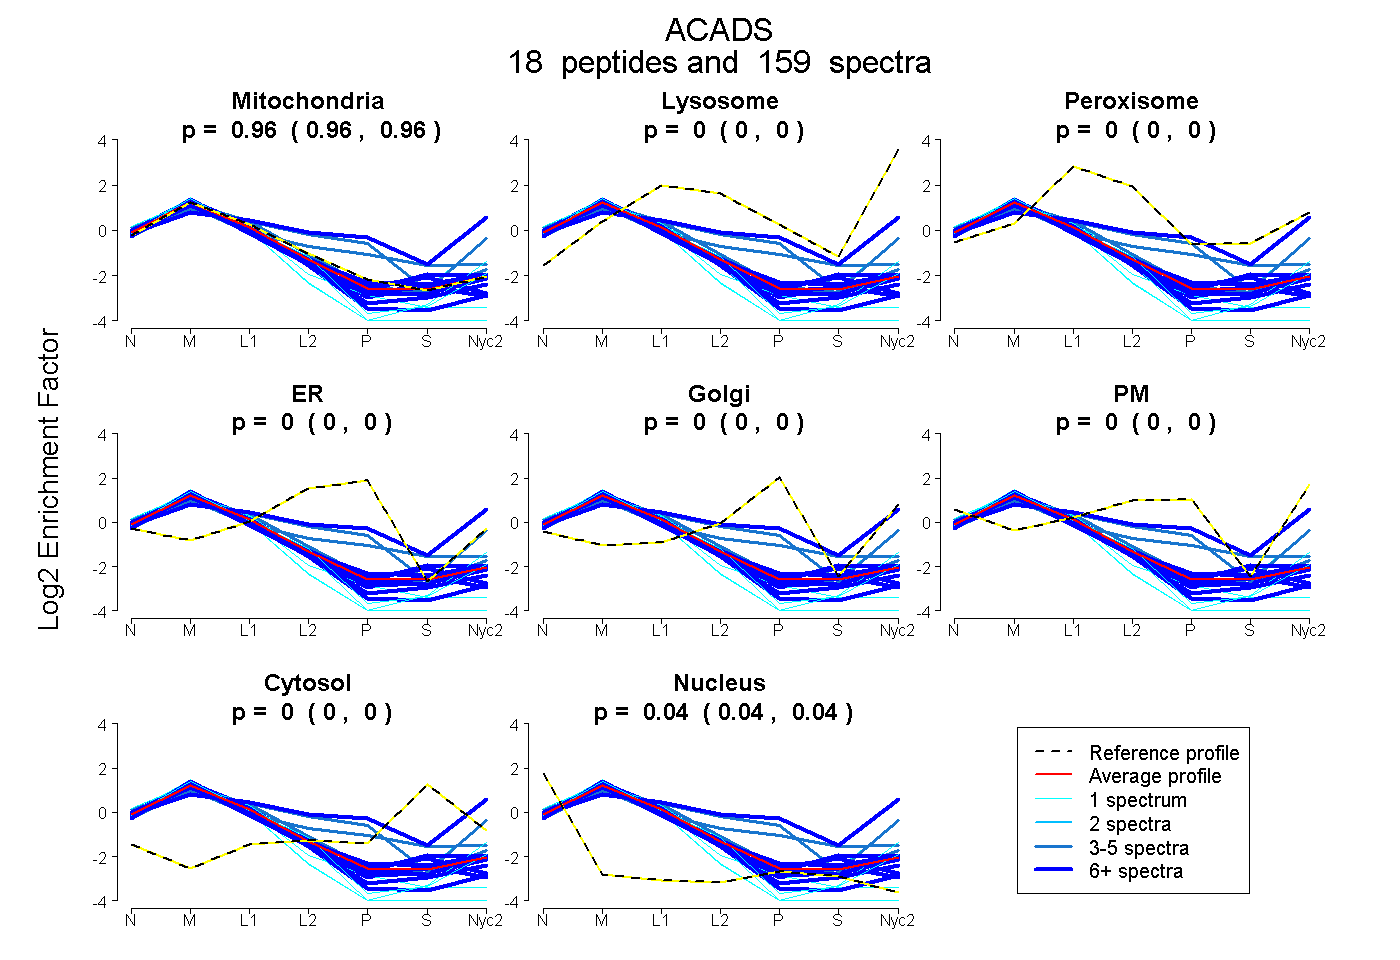
0.957 | 0.961
0.000 | 0.000
0.000 | 0.000
0.000 | 0.000
0.000 | 0.000
0.000 | 0.000
0.000 | 0.000
0.039 | 0.043
15peptides
spectra
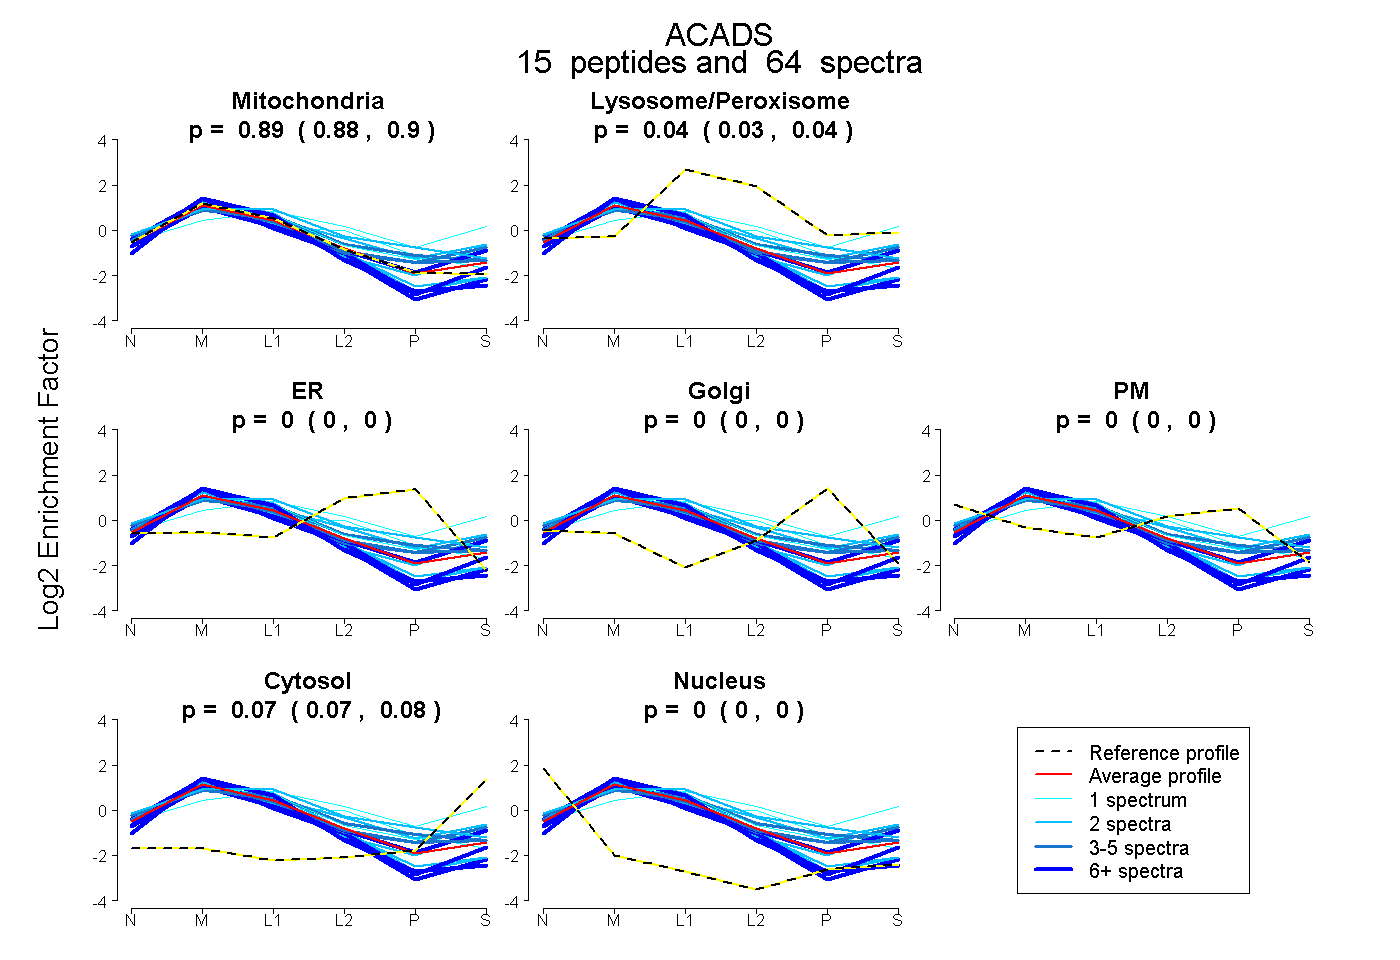
0.879 | 0.898
0.031 | 0.044
0.000 | 0.000
0.000 | 0.000
0.000 | 0.000
0.066 | 0.076
0.000 | 0.000