 2
2peptides
spectra
0.000 | 0.000
0.000 | 0.123
0.000 | 0.013
0.000 | 0.000
0.000 | 0.000
0.072 | 0.181
0.756 | 0.856
0.000 | 0.000
3peptides
spectra
0.000 | 1.000
0.000 | 1.000
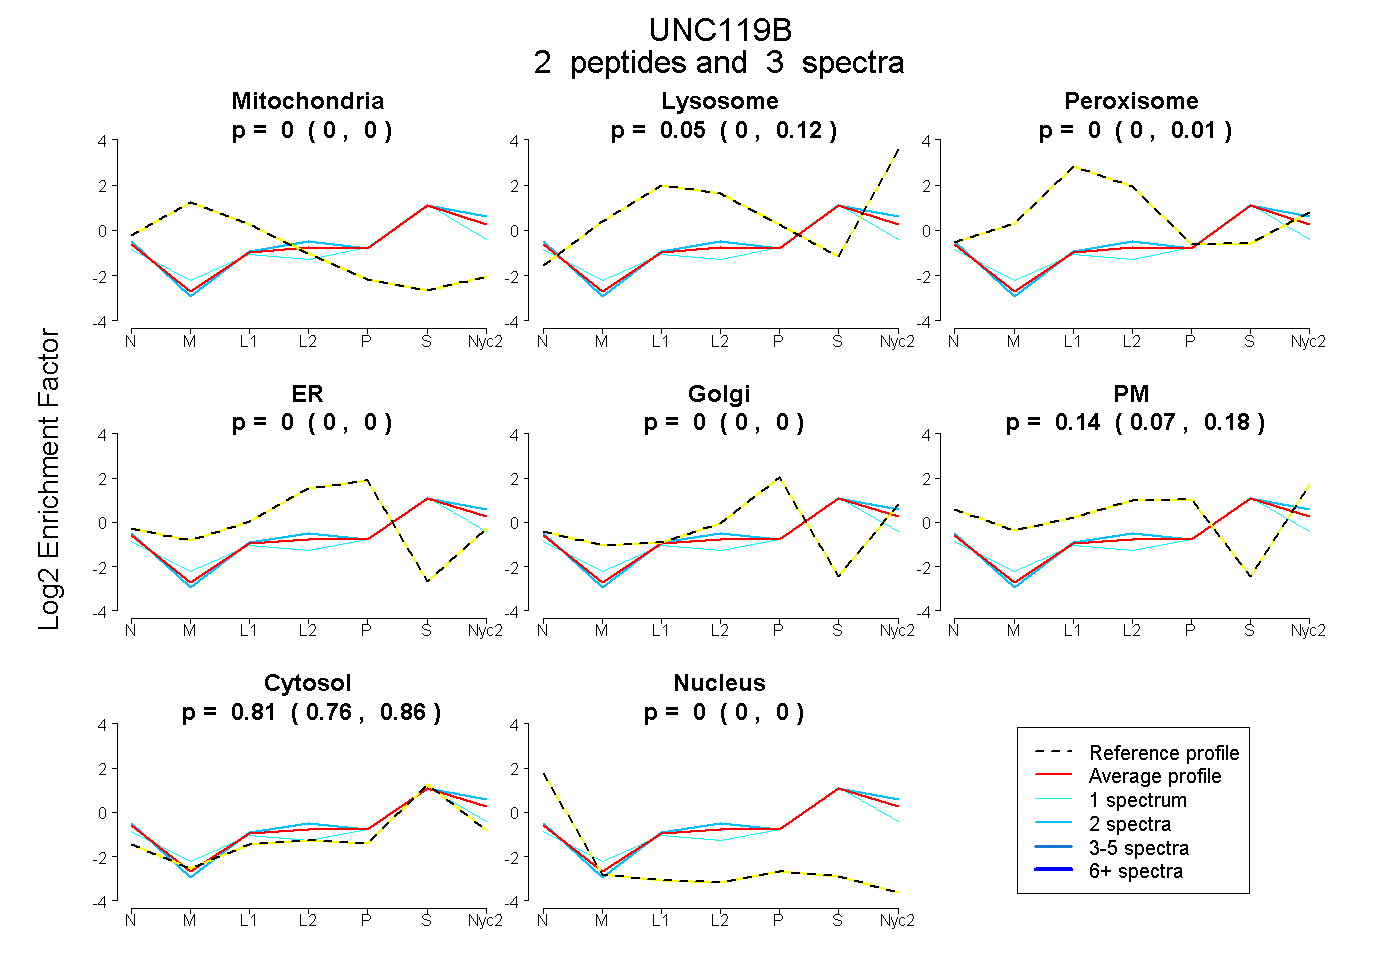
| Plot | Mito | Lyso | Perox | ER | Golgi | PM | Cytosol | Nucleus | |||||
| Expt A |
2 peptides |
3 spectra |
|
0.000 0.000 | 0.000 |
0.051 0.000 | 0.123 |
0.000 0.000 | 0.013 |
0.000 0.000 | 0.000 |
0.000 0.000 | 0.000 |
0.140 0.072 | 0.181 |
0.809 0.756 | 0.856 |
0.000 0.000 | 0.000 |
||
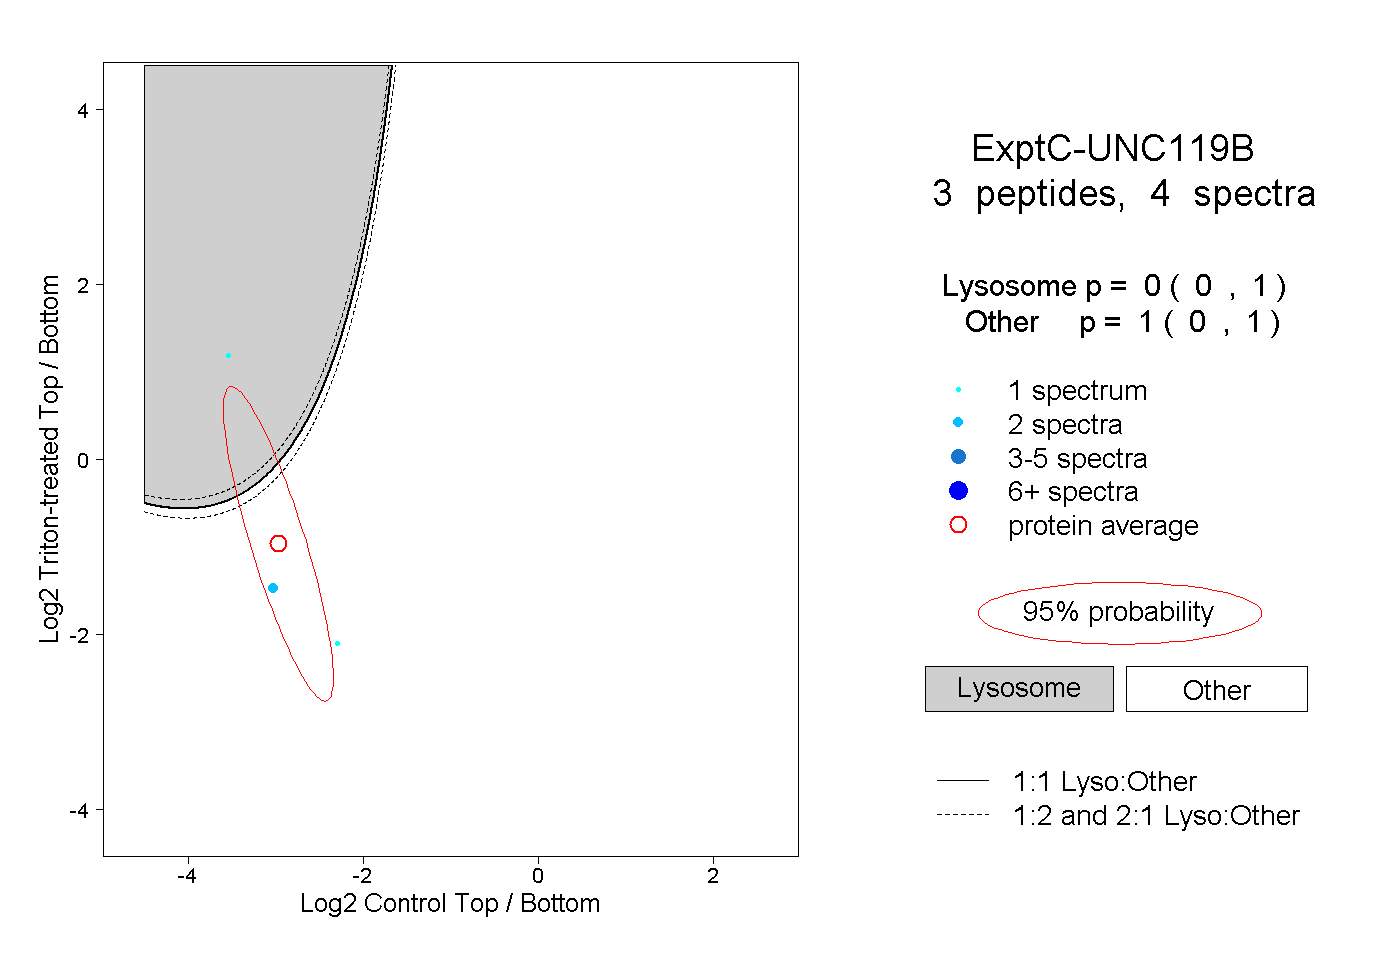
| Plot | Lyso | Other | |||||||||||
| Expt C |
3 peptides |
4 spectra |
|
0.000 0.000 | 1.000 |
1.000 0.000 | 1.000 |