 3
3peptides
spectra
0.000 | 0.000
0.000 | 0.000
0.000 | 0.085
0.290 | 0.351
0.000 | 0.000
0.000 | 0.000
0.040 | 0.163
0.500 | 0.564
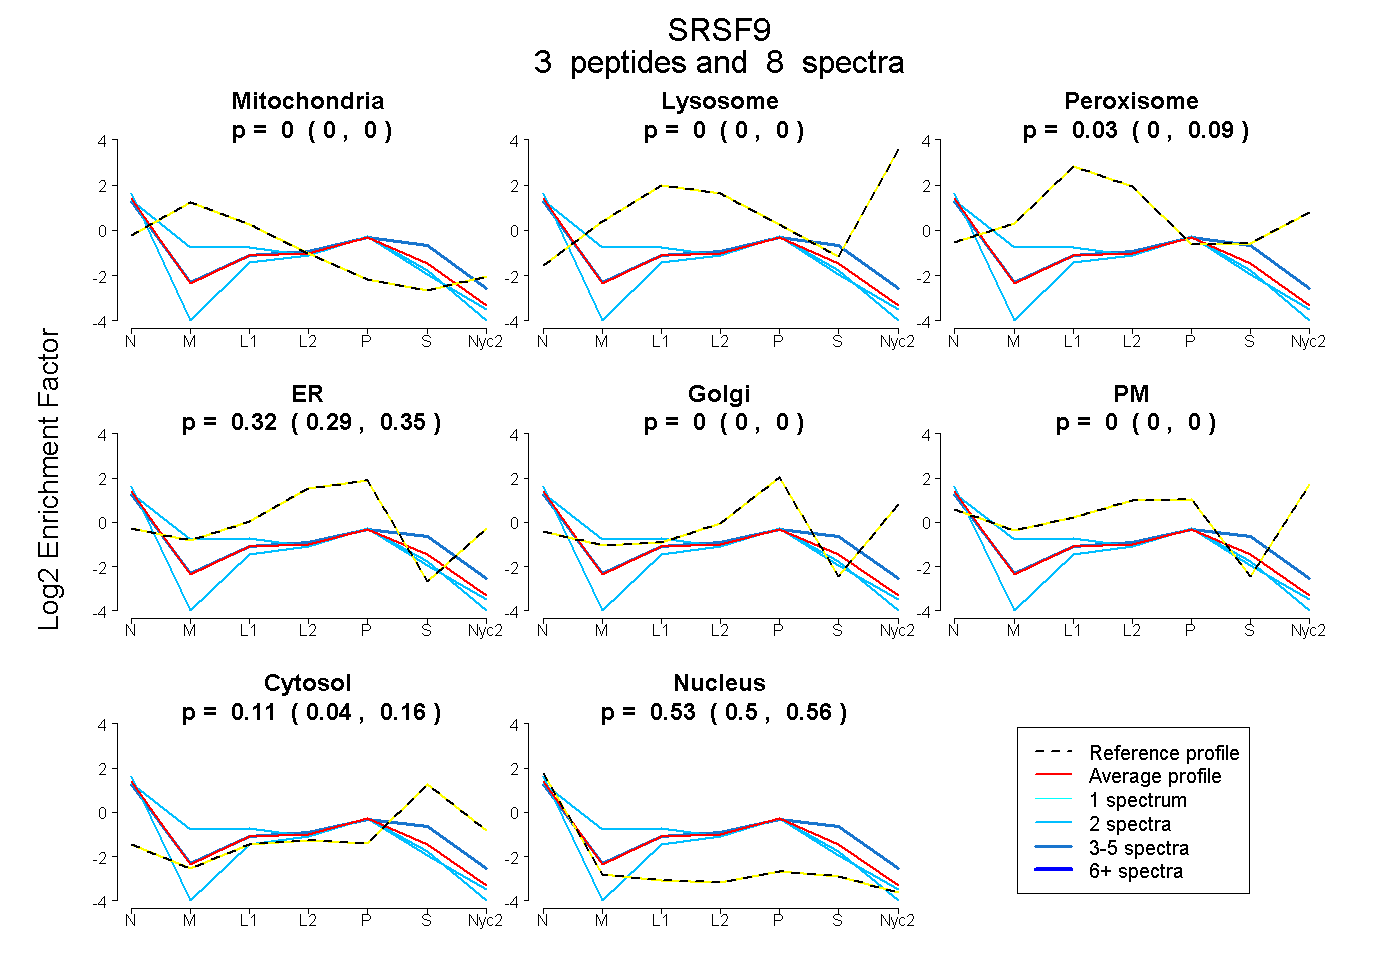
| Plot | Mito | Lyso | Perox | ER | Golgi | PM | Cytosol | Nucleus | |||||
| Expt A |
3 peptides |
8 spectra |
|
0.000 0.000 | 0.000 |
0.000 0.000 | 0.000 |
0.034 0.000 | 0.085 |
0.325 0.290 | 0.351 |
0.000 0.000 | 0.000 |
0.000 0.000 | 0.000 |
0.107 0.040 | 0.163 |
0.535 0.500 | 0.564 |
| 4 spectra, DAEDAIYGR | 0.000 | 0.000 | 0.054 | 0.264 | 0.000 | 0.000 | 0.272 | 0.410 | ||
| 2 spectra, IYVGNLPTDVR | 0.255 | 0.000 | 0.000 | 0.322 | 0.000 | 0.000 | 0.000 | 0.423 | ||
| 2 spectra, HGLVPFAFVR | 0.000 | 0.000 | 0.000 | 0.277 | 0.000 | 0.000 | 0.072 | 0.651 |
| Plot | Mito | Lyso or Perox | ER | Golgi | PM | Cytosol | Nucleus | ||||||
| Expt B |
1 peptide |
2 spectra |
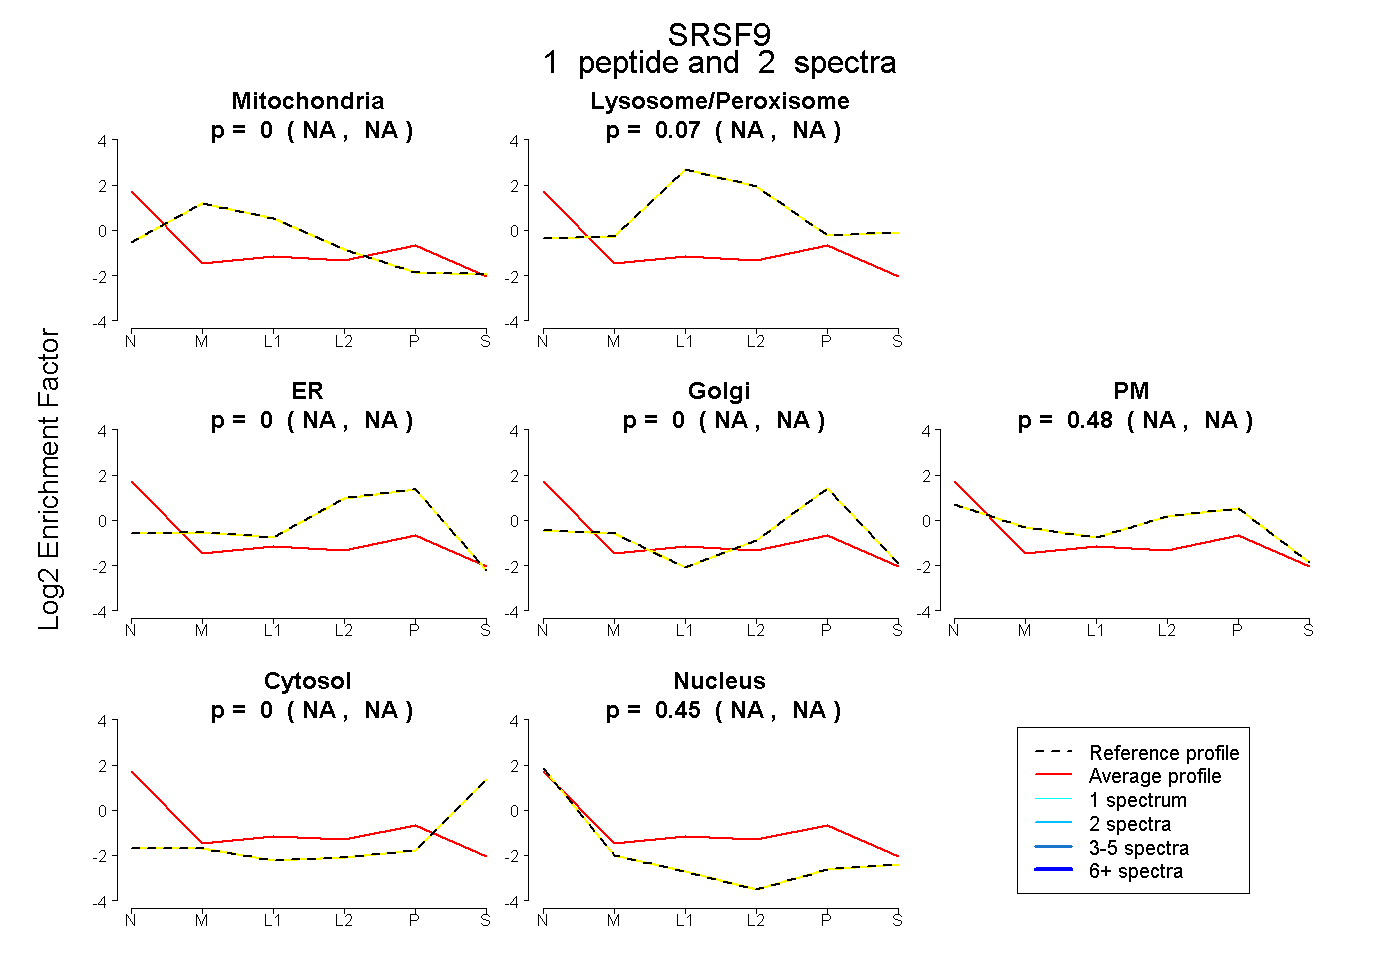 |
0.000 NA | NA |
0.071 NA | NA |
0.000 NA | NA |
0.000 NA | NA |
0.481 NA | NA |
0.000 NA | NA |
0.447 NA | NA |
|||
| Plot | Lyso | Other | |||||||||||
| Expt C |
2 peptides |
4 spectra |
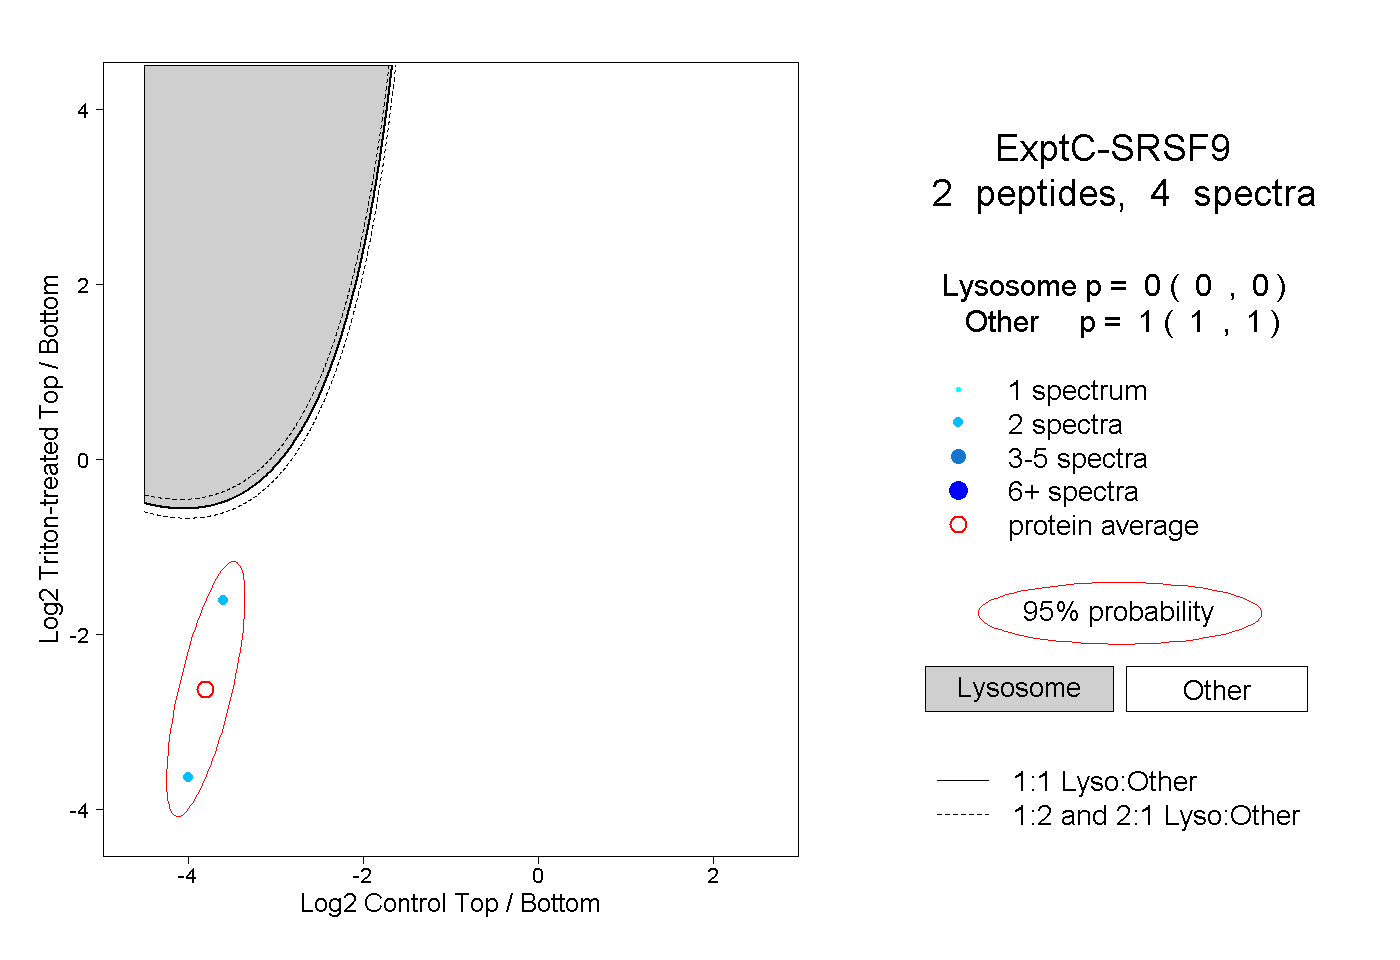 |
0.000 0.000 | 0.000 |
1.000 1.000 | 1.000 |