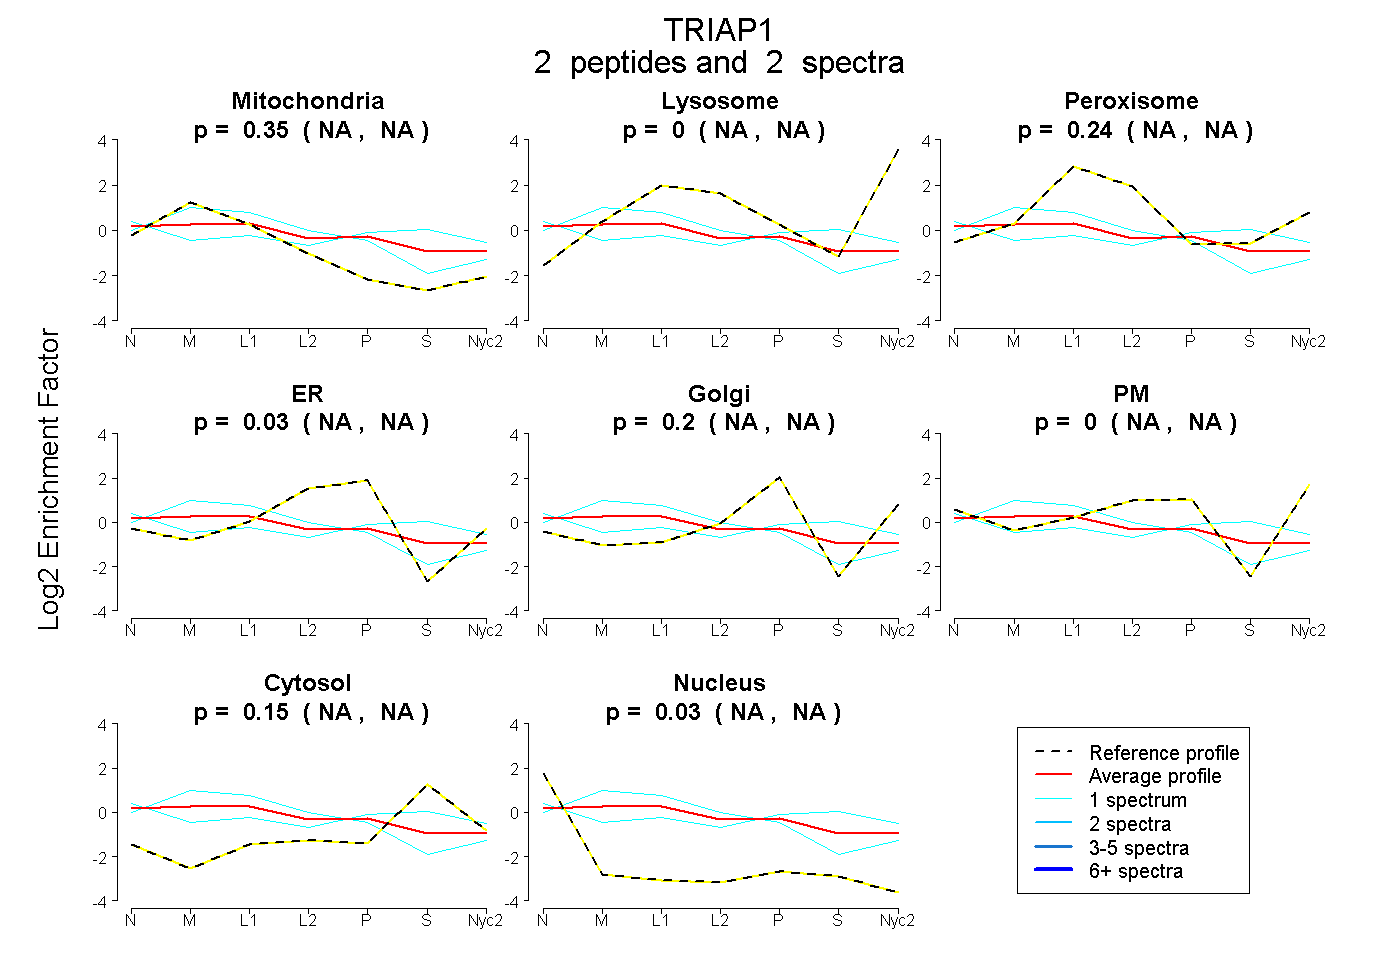
 2
2peptides
spectra
NA | NA
NA | NA
NA | NA
NA | NA
NA | NA
NA | NA
NA | NA
NA | NA
| Plot | Mito | Lyso | Perox | ER | Golgi | PM | Cytosol | Nucleus | |||||
| Expt A |
2 peptides |
2 spectra |
|
0.352 NA | NA |
0.000 NA | NA |
0.243 NA | NA |
0.025 NA | NA |
0.201 NA | NA |
0.000 NA | NA |
0.146 NA | NA |
0.033 NA | NA |
| 1 spectrum, GDGSGDPCTDLFK | 0.149 | 0.000 | 0.119 | 0.000 | 0.035 | 0.258 | 0.406 | 0.034 | ||
| 1 spectrum, EIPIEGLEFMGHGK | 0.565 | 0.000 | 0.192 | 0.243 | 0.000 | 0.000 | 0.000 | 0.000 |
| Plot | Lyso | Other | |||||||||||
| Expt C |
3 peptides |
8 spectra |
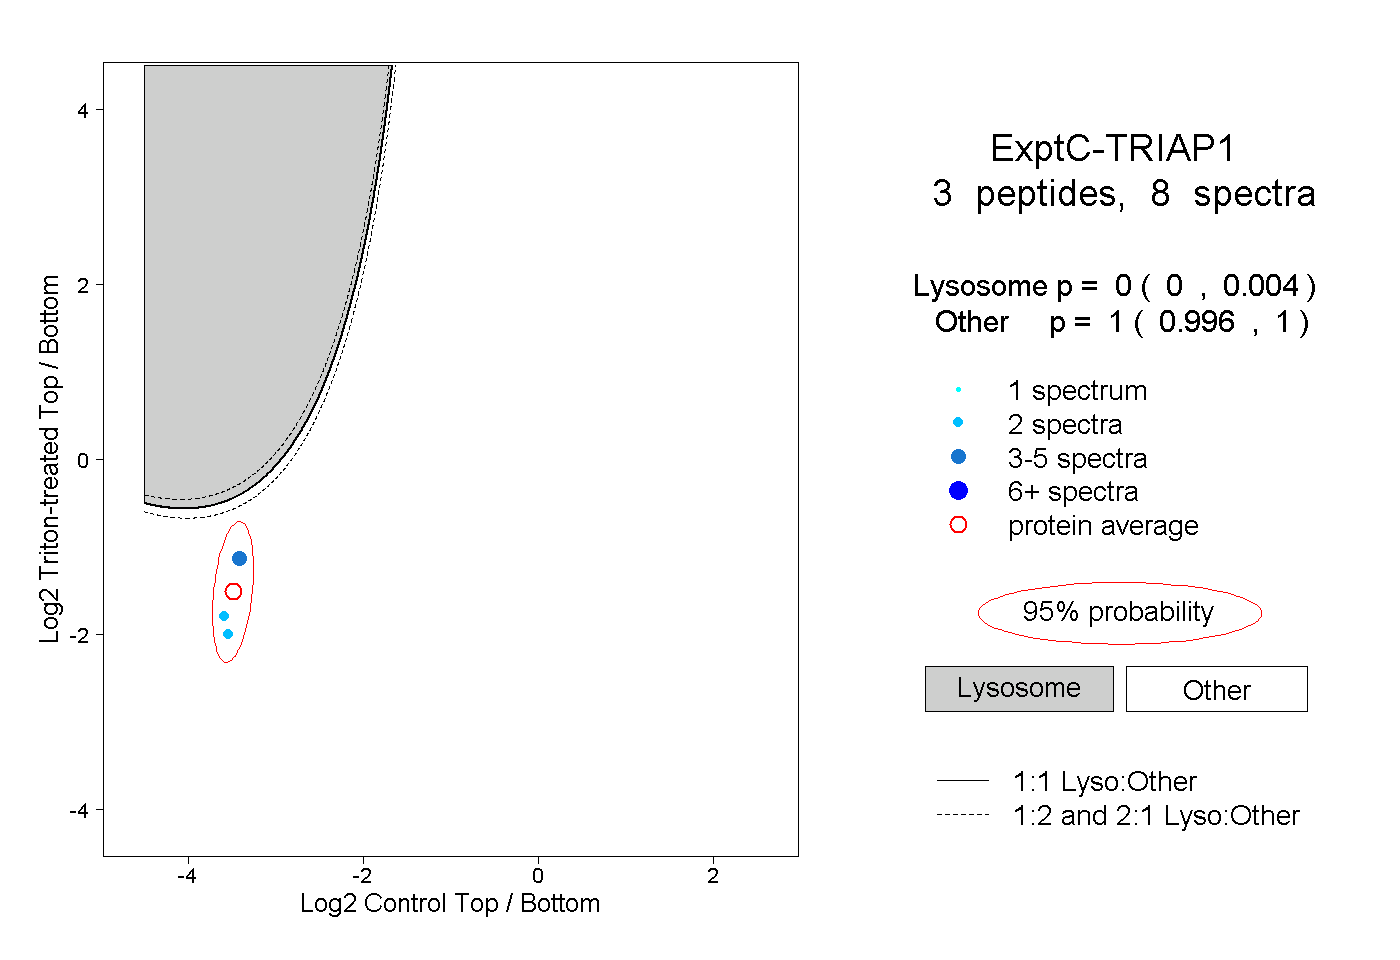 |
0.000 0.000 | 0.004 |
1.000 0.996 | 1.000 |