 1
1peptide
spectra
NA | NA
NA | NA
NA | NA
NA | NA
NA | NA
NA | NA
NA | NA
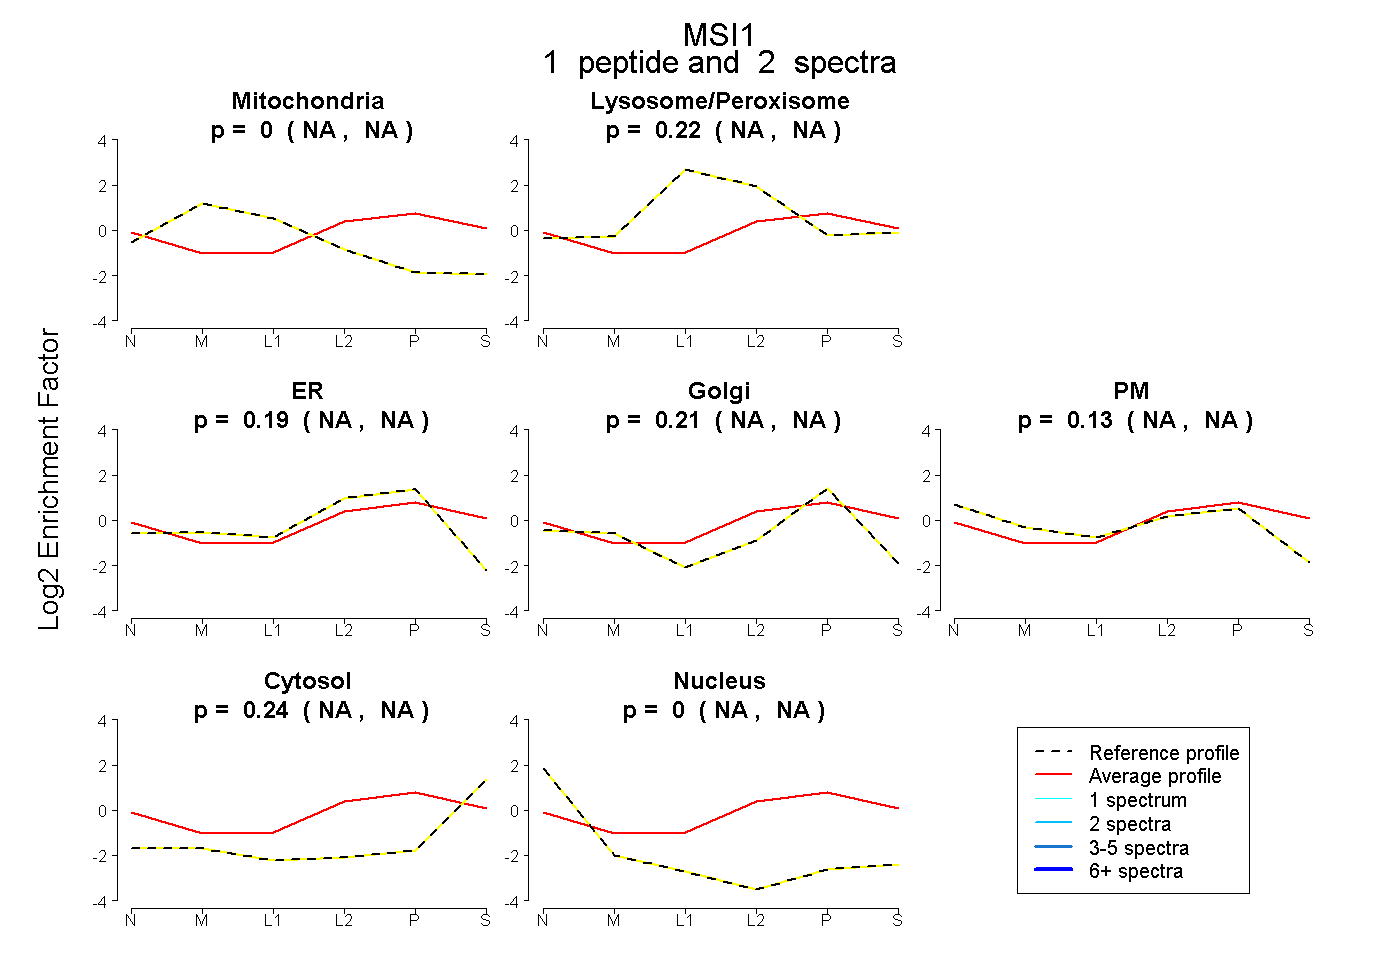
| Plot | Mito | Lyso or Perox | ER | Golgi | PM | Cytosol | Nucleus | ||||||
| Expt B |
1 peptide |
2 spectra |
|
0.000 NA | NA |
0.222 NA | NA |
0.193 NA | NA |
0.209 NA | NA |
0.134 NA | NA |
0.242 NA | NA |
0.000 NA | NA |
| 2 spectra, VCEIHFHEINNK | 0.000 | 0.222 | 0.193 | 0.209 | 0.134 | 0.242 | 0.000 |