17
17peptides
spectra
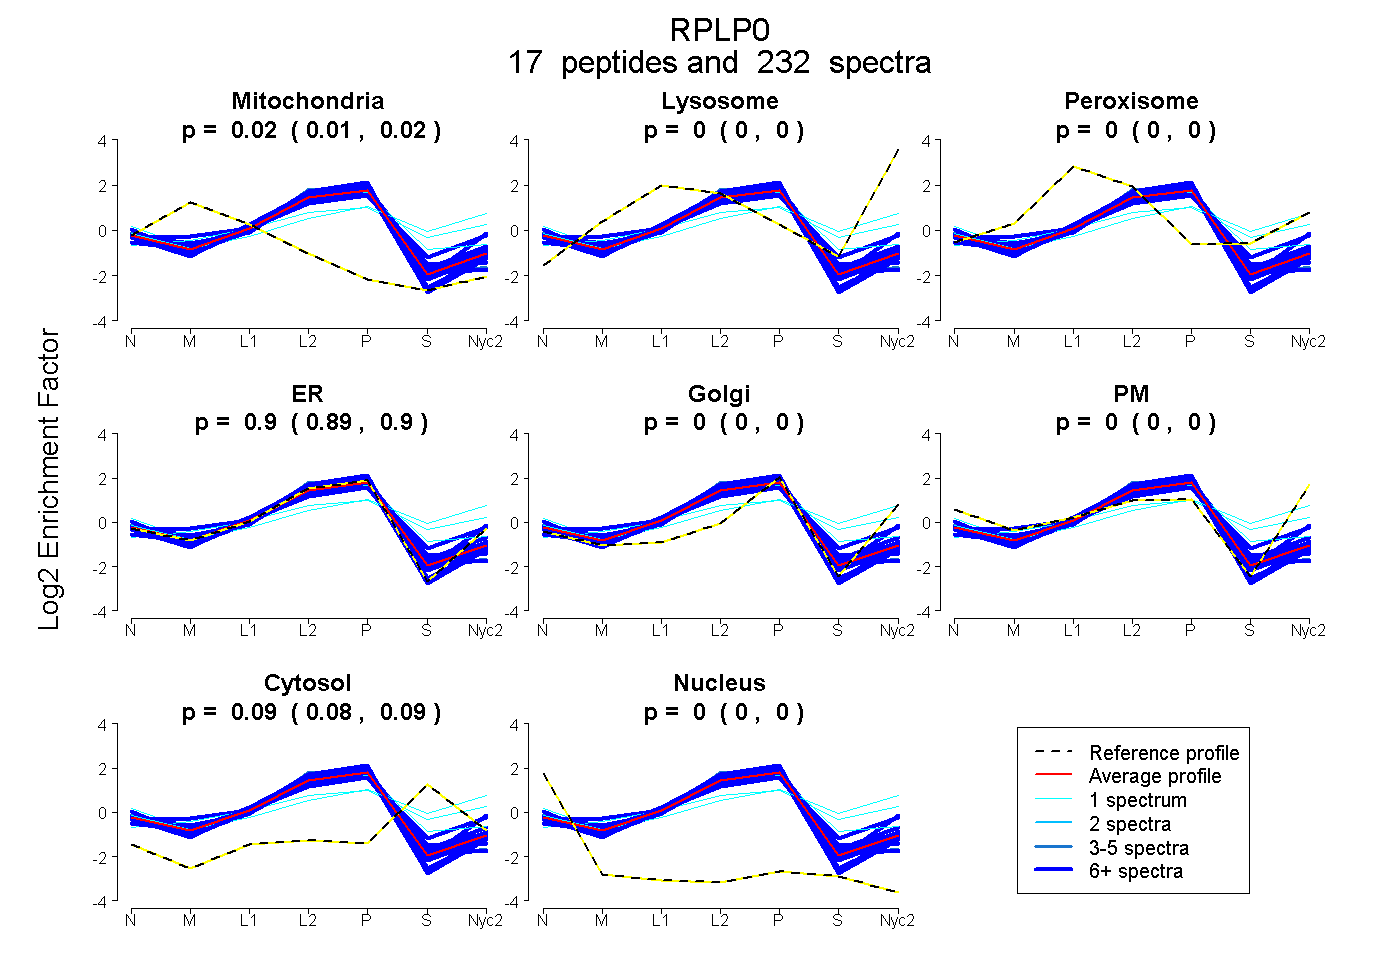
0.015 | 0.019
0.000 | 0.000
0.000 | 0.002
0.894 | 0.898
0.000 | 0.000
0.000 | 0.000
0.084 | 0.089
0.000 | 0.000
15peptides
spectra
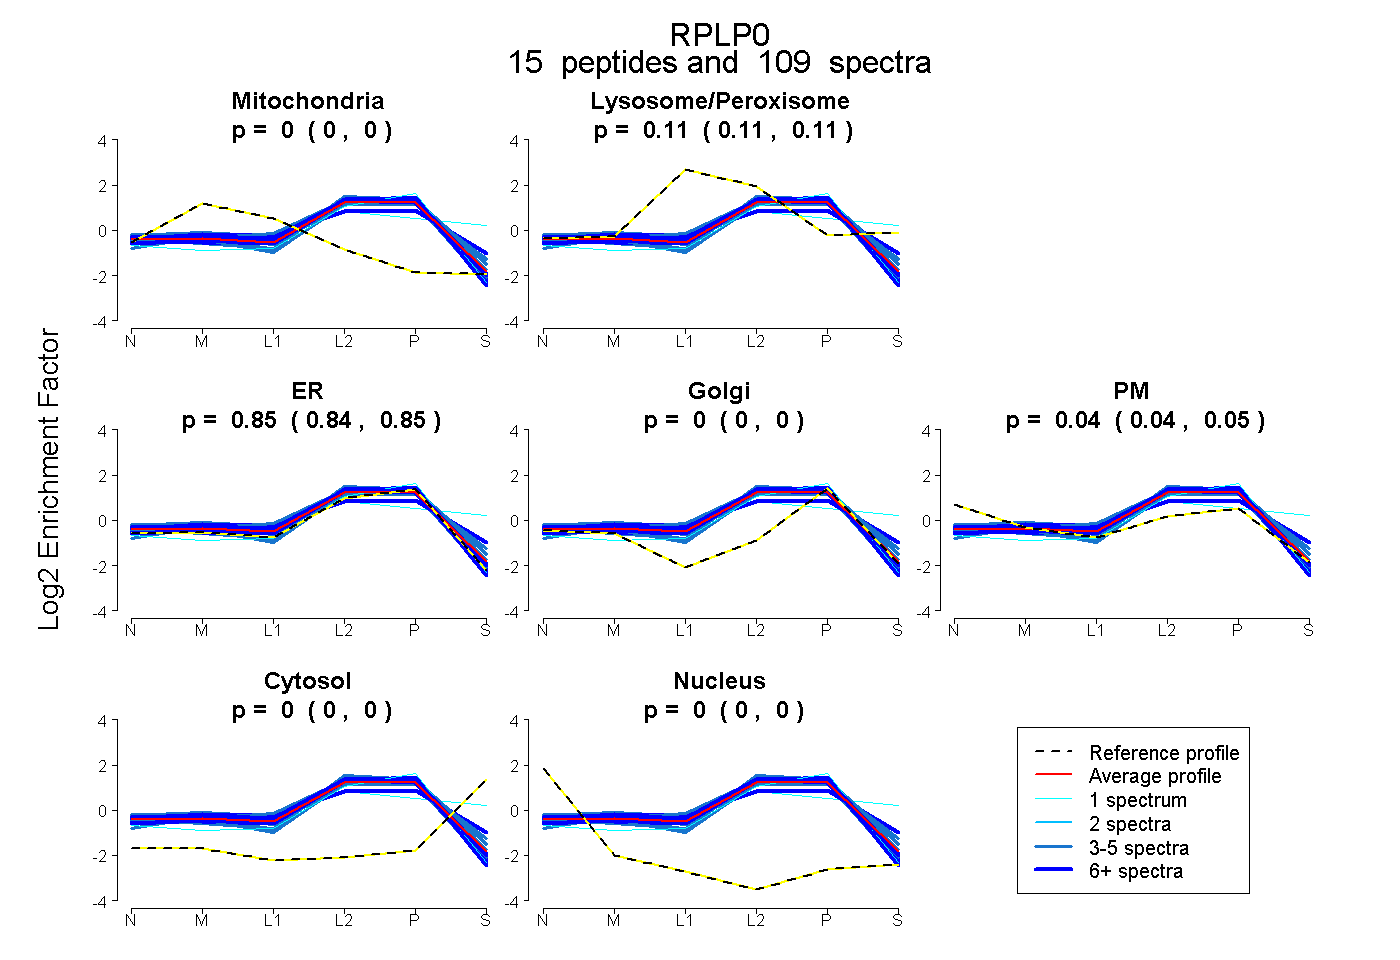
0.000 | 0.000
0.106 | 0.112
0.842 | 0.853
0.000 | 0.000
0.038 | 0.047
0.000 | 0.000
0.000 | 0.000
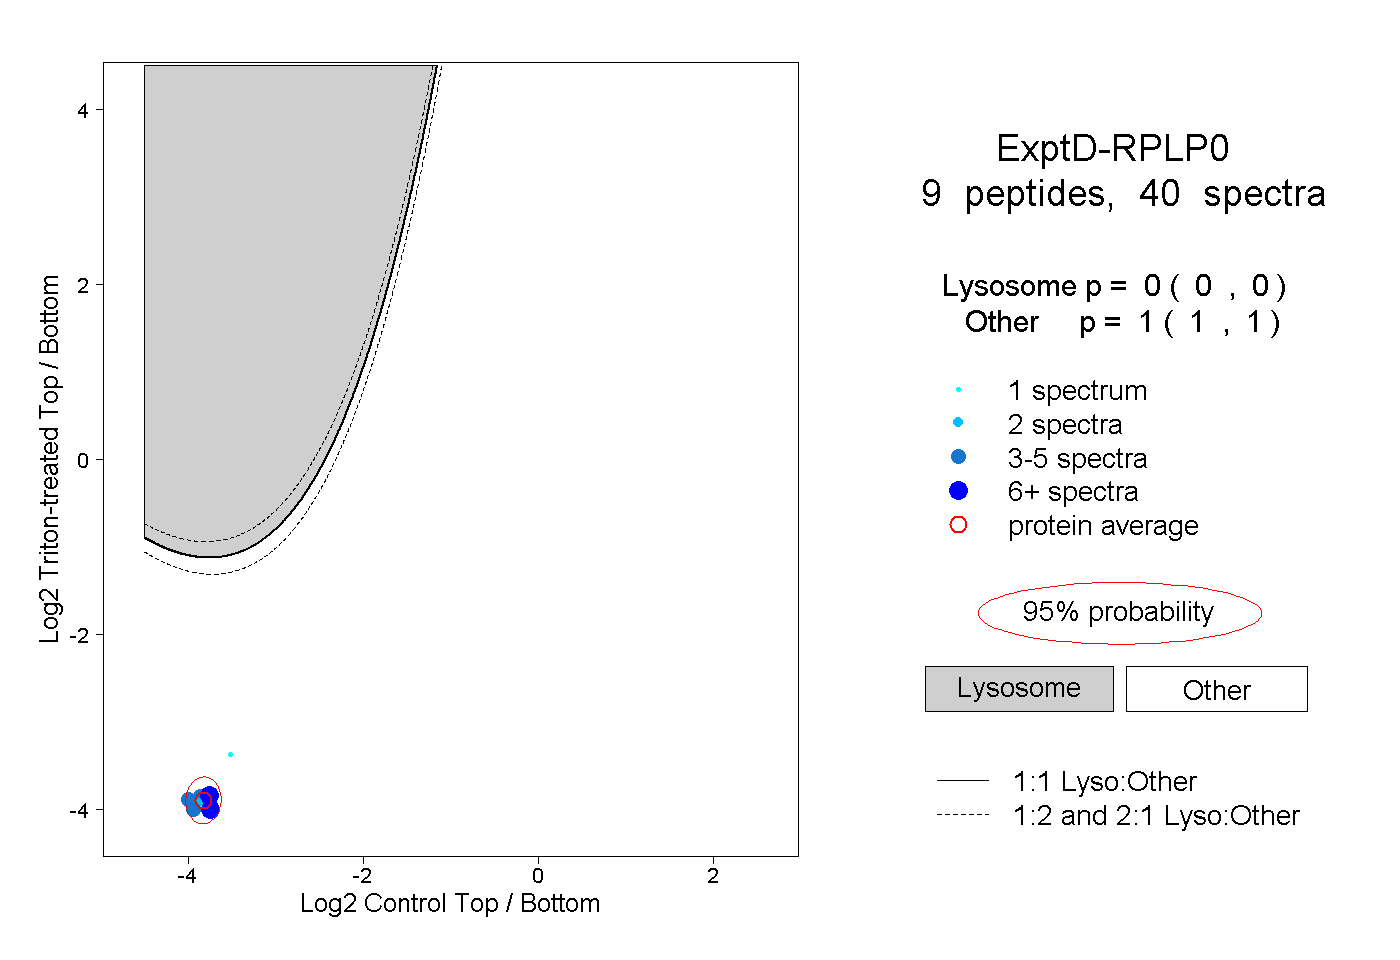
15peptides
spectra
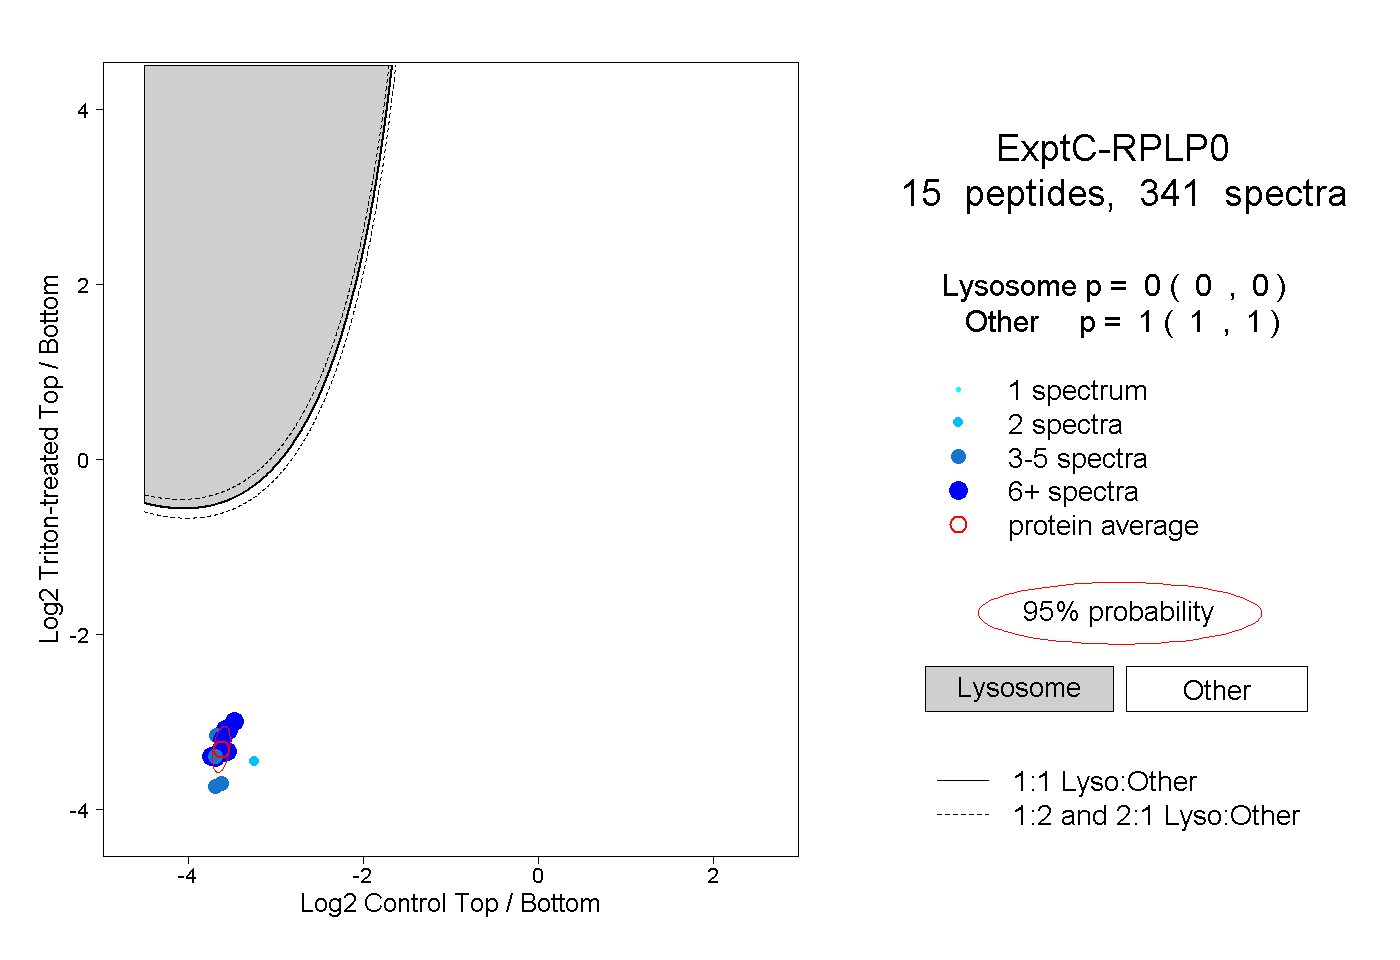
0.000 | 0.000
1.000 | 1.000