 3
3peptides
spectra
0.000 | 0.079
0.000 | 0.000
0.017 | 0.118
0.313 | 0.543
0.000 | 0.129
0.000 | 0.146
0.286 | 0.413
0.000 | 0.078
1peptide
spectra
NA | NA
NA | NA
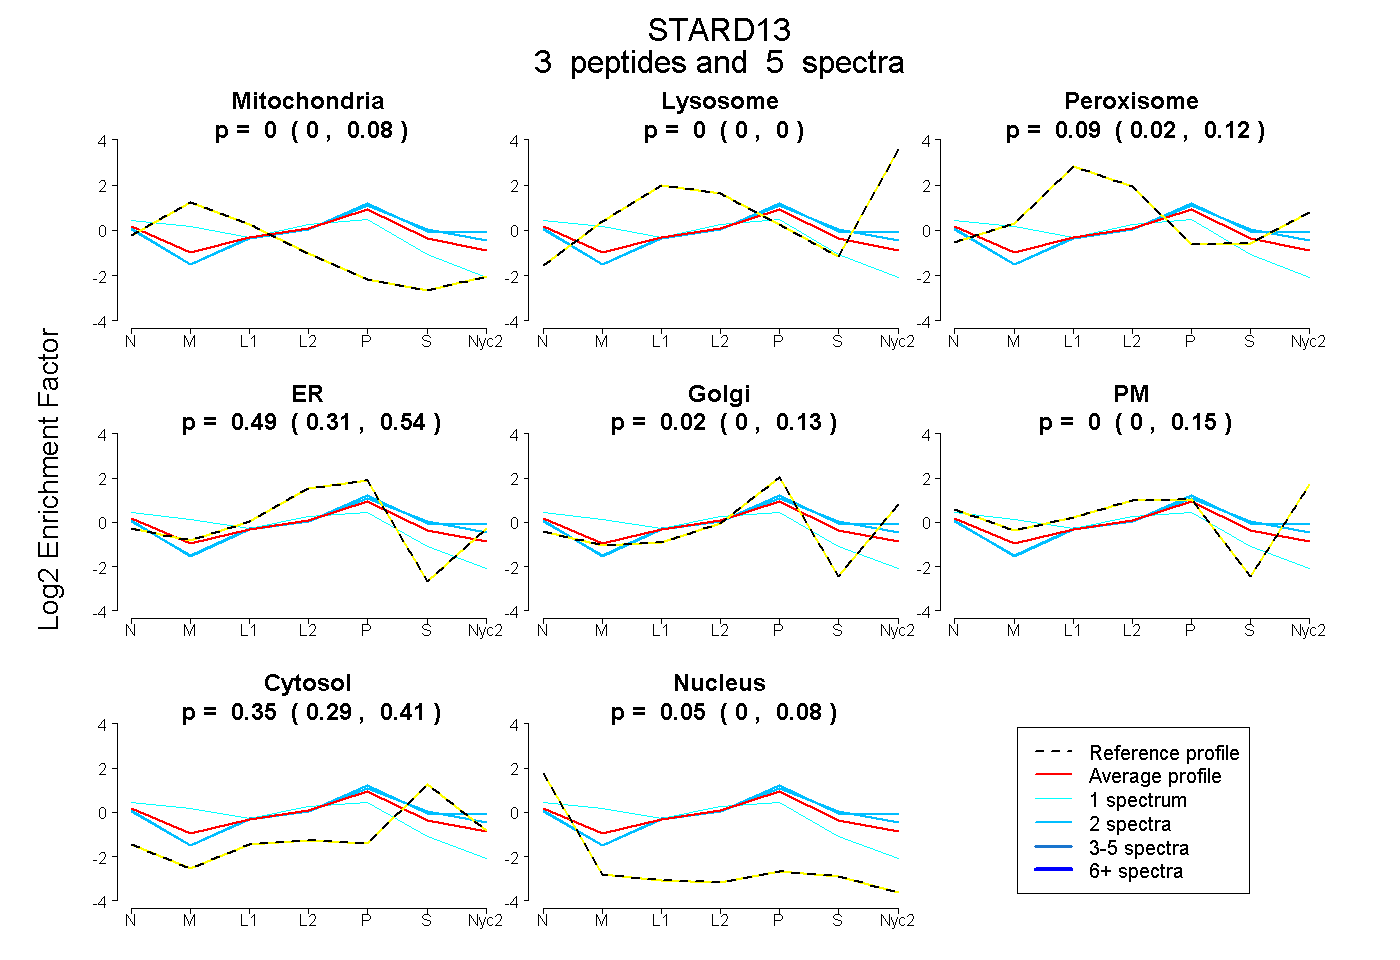
| Plot | Mito | Lyso | Perox | ER | Golgi | PM | Cytosol | Nucleus | |||||
| Expt A |
3 peptides |
5 spectra |
|
0.000 0.000 | 0.079 |
0.000 0.000 | 0.000 |
0.091 0.017 | 0.118 |
0.491 0.313 | 0.543 |
0.019 0.000 | 0.129 |
0.000 0.000 | 0.146 |
0.354 0.286 | 0.413 |
0.046 0.000 | 0.078 |
||
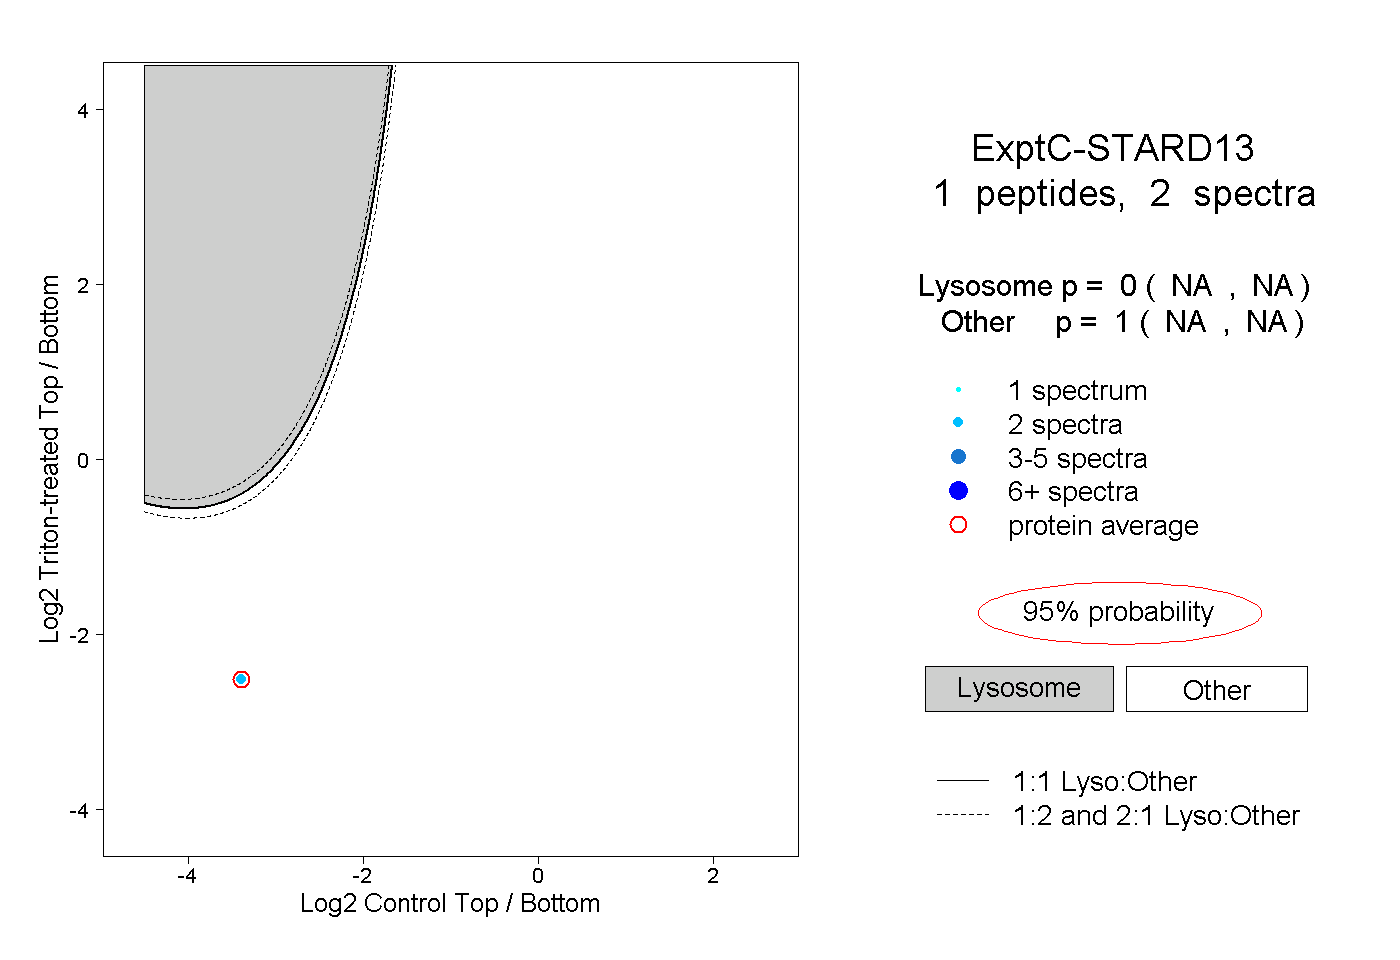
| Plot | Lyso | Other | |||||||||||
| Expt C |
1 peptide |
2 spectra |
|
0.000 NA | NA |
1.000 NA | NA |