 3
3peptides
spectra
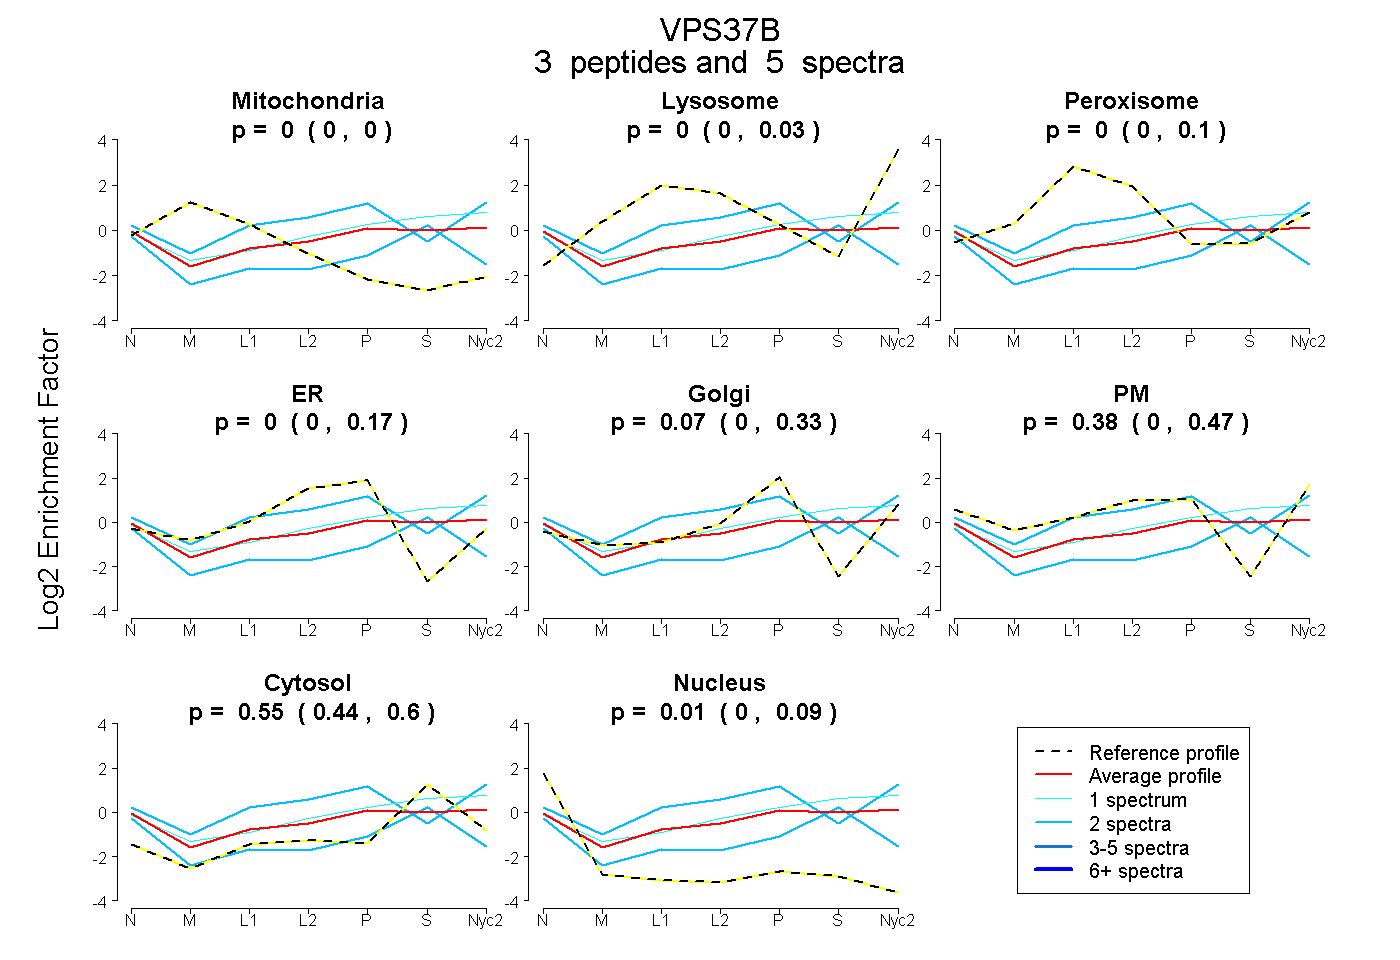
0.000 | 0.000
0.000 | 0.033
0.000 | 0.101
0.000 | 0.171
0.000 | 0.333
0.001 | 0.466
0.435 | 0.598
0.000 | 0.087
| Plot | Mito | Lyso | Perox | ER | Golgi | PM | Cytosol | Nucleus | |||||
| Expt A |
3 peptides |
5 spectra |
|
0.000 0.000 | 0.000 |
0.000 0.000 | 0.033 |
0.000 0.000 | 0.101 |
0.000 0.000 | 0.171 |
0.066 0.000 | 0.333 |
0.377 0.001 | 0.466 |
0.549 0.435 | 0.598 |
0.008 0.000 | 0.087 |
| 2 spectra, EMTLASNR | 0.000 | 0.068 | 0.101 | 0.000 | 0.148 | 0.469 | 0.215 | 0.000 | ||
| 1 spectrum, GMEETQTVQHNK | 0.000 | 0.056 | 0.000 | 0.000 | 0.000 | 0.385 | 0.560 | 0.000 | ||
| 2 spectra, LAHIR | 0.000 | 0.000 | 0.000 | 0.011 | 0.078 | 0.000 | 0.671 | 0.240 |
| Plot | Lyso | Other | |||||||||||
| Expt C |
3 peptides |
3 spectra |
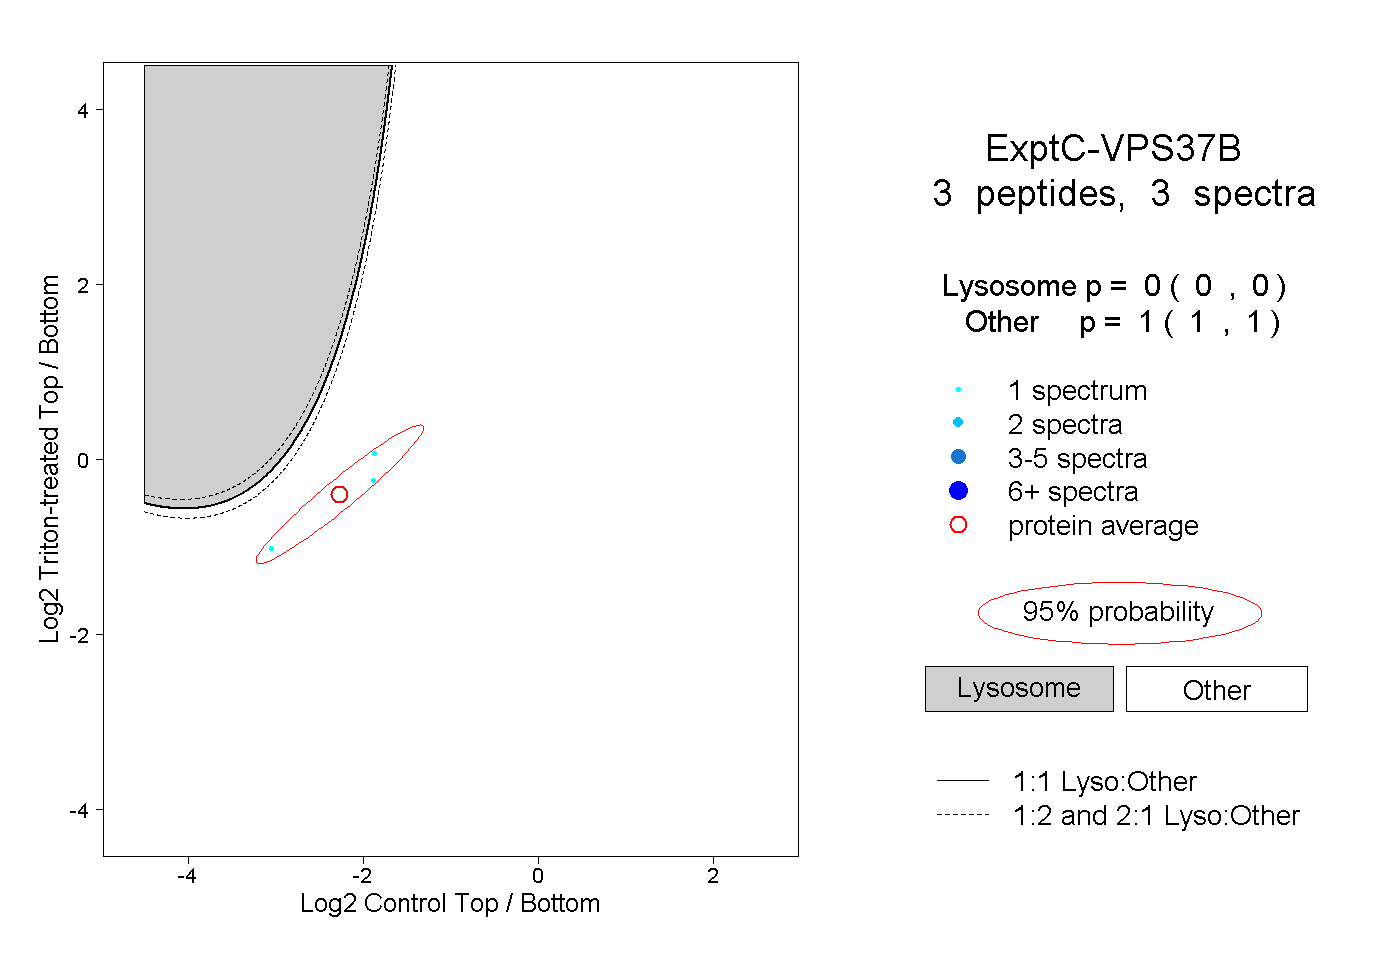 |
0.000 0.000 | 0.000 |
1.000 1.000 | 1.000 |