 4
4peptides
spectra
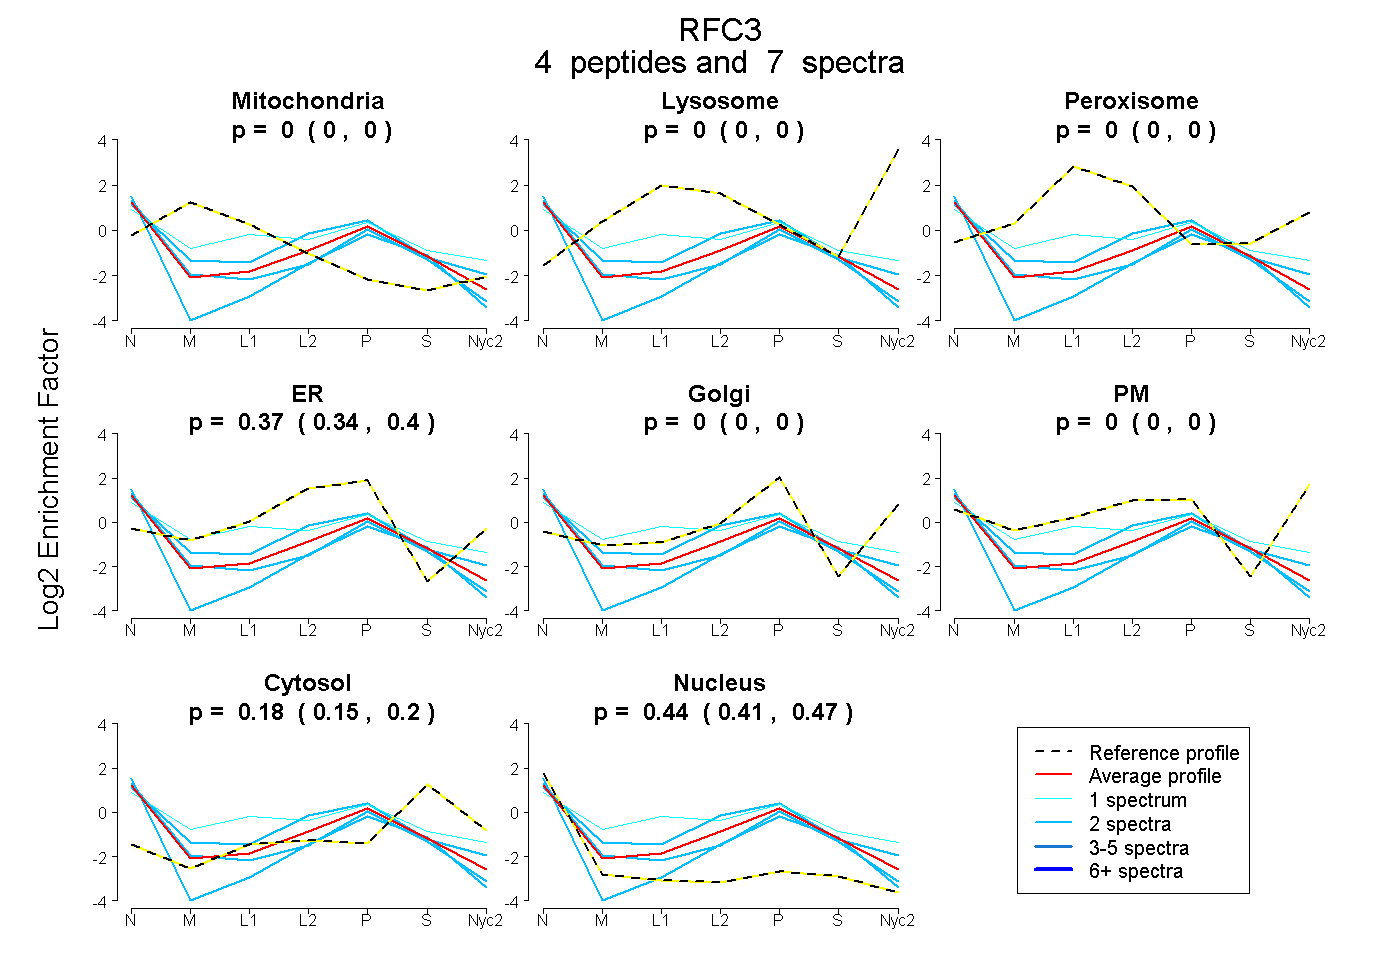
0.000 | 0.000
0.000 | 0.000
0.000 | 0.000
0.337 | 0.404
0.000 | 0.000
0.000 | 0.000
0.155 | 0.204
0.412 | 0.469
| Plot | Mito | Lyso | Perox | ER | Golgi | PM | Cytosol | Nucleus | |||||
| Expt A |
4 peptides |
7 spectra |
|
0.000 0.000 | 0.000 |
0.000 0.000 | 0.000 |
0.000 0.000 | 0.000 |
0.374 0.337 | 0.404 |
0.000 0.000 | 0.000 |
0.000 0.000 | 0.000 |
0.183 0.155 | 0.204 |
0.443 0.412 | 0.469 |
| 2 spectra, TVAQSQQLETSSQR | 0.000 | 0.000 | 0.000 | 0.153 | 0.000 | 0.000 | 0.216 | 0.631 | ||
| 2 spectra, VIPPIR | 0.000 | 0.000 | 0.000 | 0.521 | 0.000 | 0.000 | 0.160 | 0.319 | ||
| 1 spectrum, YRPSSLAR | 0.000 | 0.000 | 0.255 | 0.300 | 0.054 | 0.000 | 0.125 | 0.267 | ||
| 2 spectra, IMCILR | 0.000 | 0.000 | 0.000 | 0.305 | 0.000 | 0.000 | 0.145 | 0.550 |
| Plot | Lyso | Other | |||||||||||
| Expt C |
1 peptide |
1 spectrum |
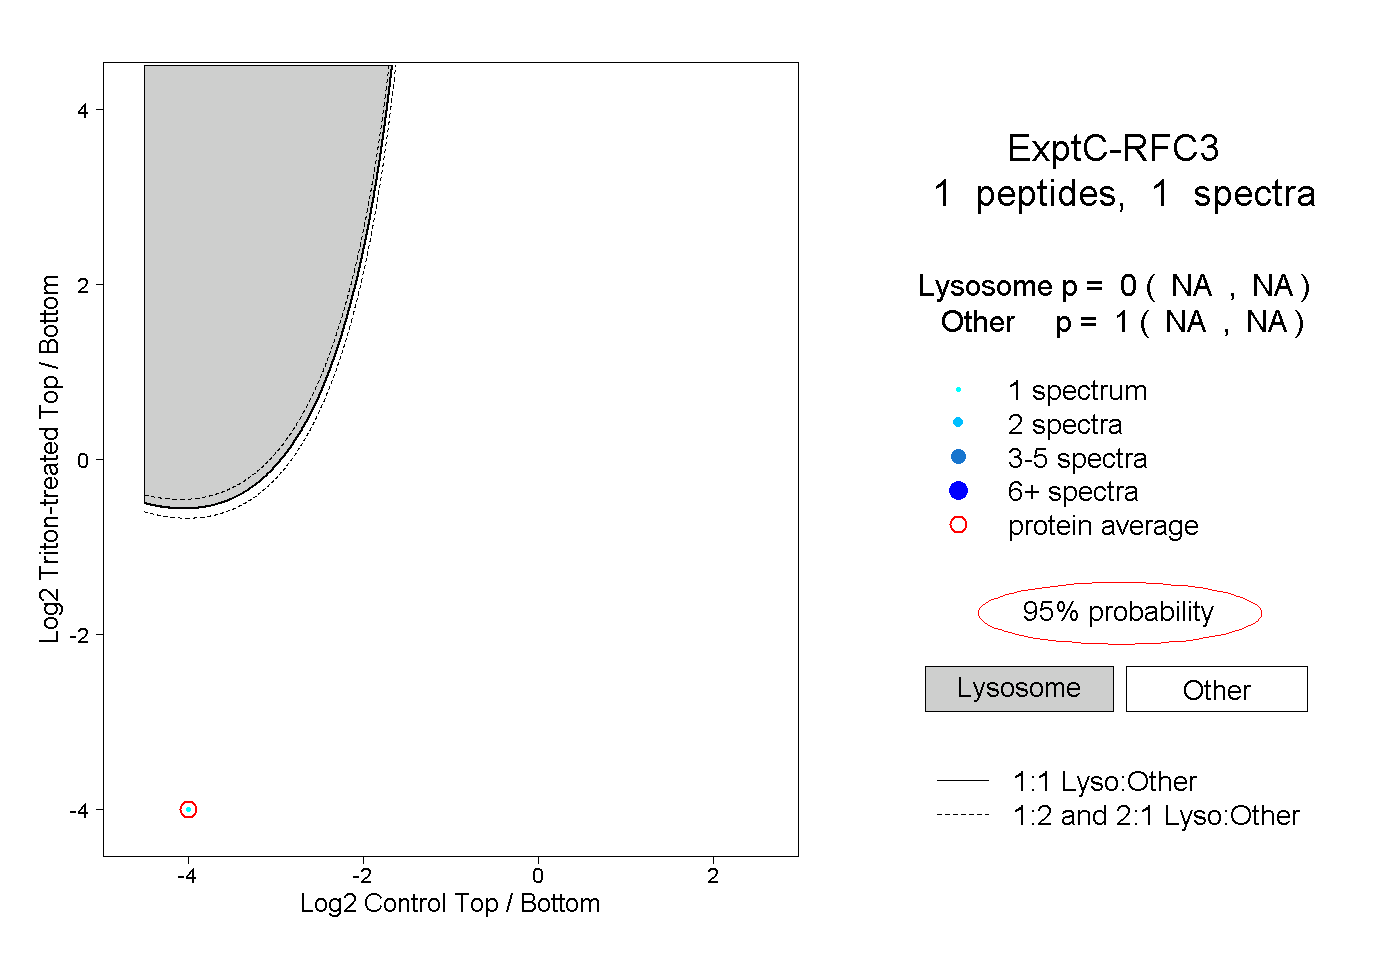 |
0.000 NA | NA |
1.000 NA | NA |