 1
1peptide
spectra
0.000 | 0.046
0.000 | 0.036
0.141 | 0.286
0.000 | 0.107
0.000 | 0.043
0.000 | 0.000
0.664 | 0.781
0.000 | 0.000
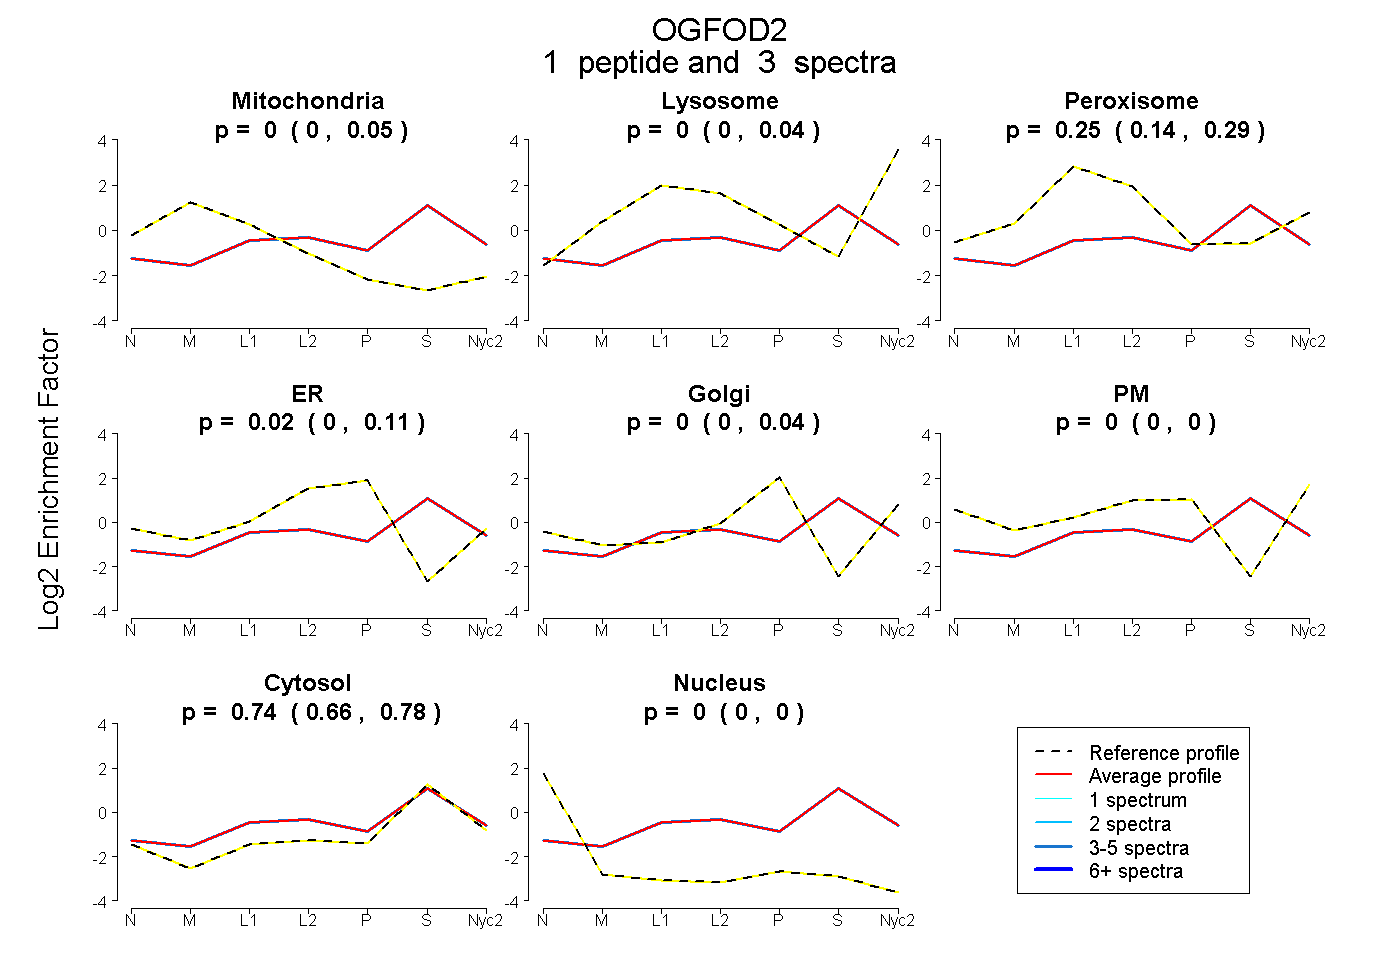
| Plot | Mito | Lyso | Perox | ER | Golgi | PM | Cytosol | Nucleus | |||||
| Expt A |
1 peptide |
3 spectra |
|
0.000 0.000 | 0.046 |
0.000 0.000 | 0.036 |
0.246 0.141 | 0.286 |
0.017 0.000 | 0.107 |
0.000 0.000 | 0.043 |
0.000 0.000 | 0.000 |
0.737 0.664 | 0.781 |
0.000 0.000 | 0.000 |
| 3 spectra, YGLHLR | 0.000 | 0.000 | 0.246 | 0.017 | 0.000 | 0.000 | 0.737 | 0.000 |
| Plot | Lyso | Other | |||||||||||
| Expt C |
2 peptides |
10 spectra |
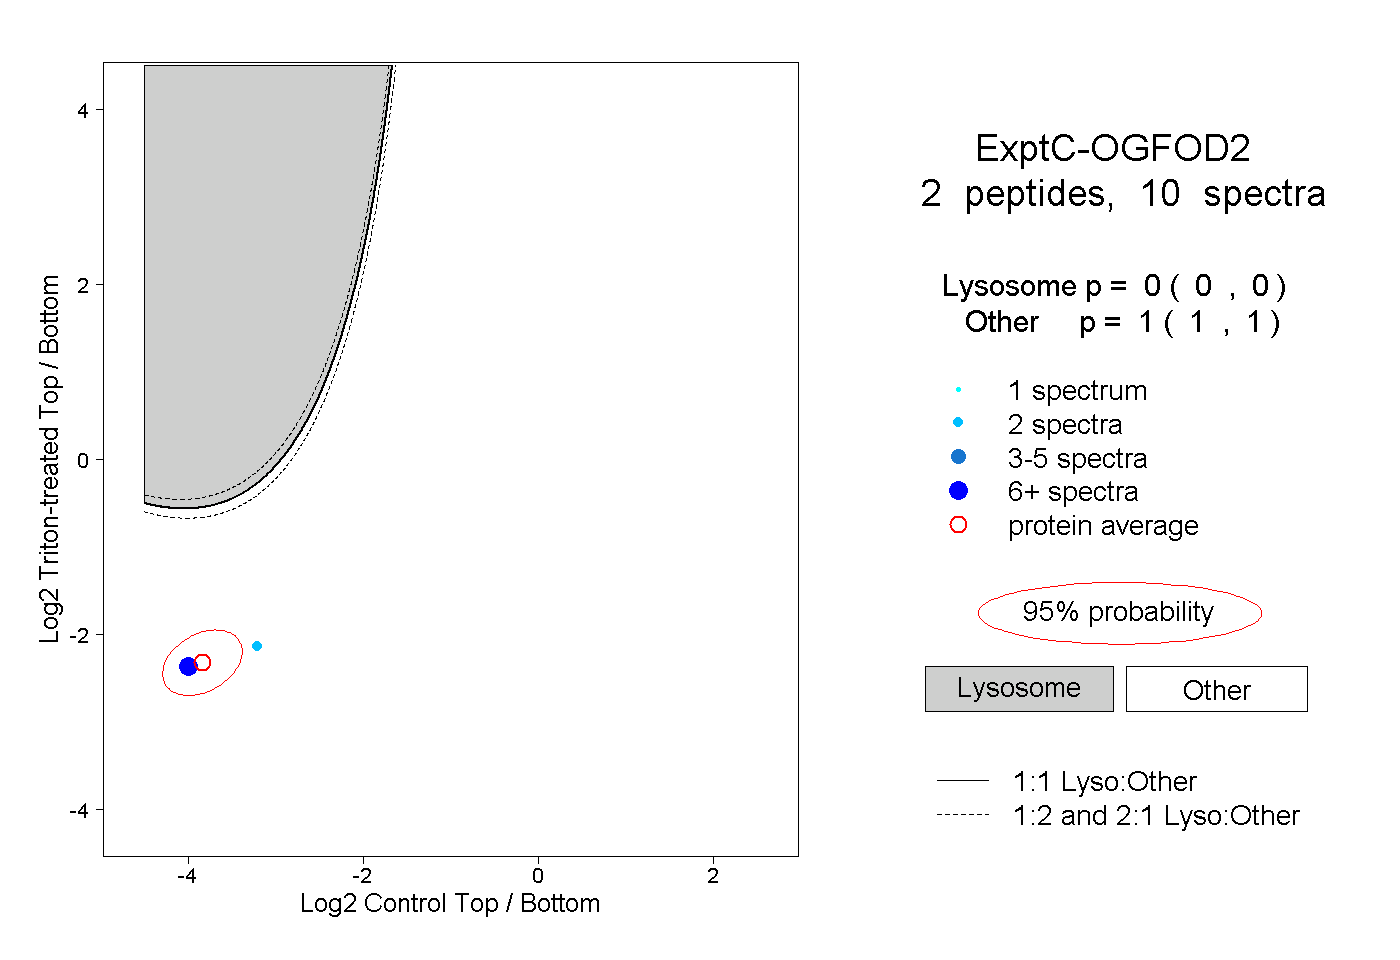 |
0.000 0.000 | 0.000 |
1.000 1.000 | 1.000 |