16
16peptides
spectra
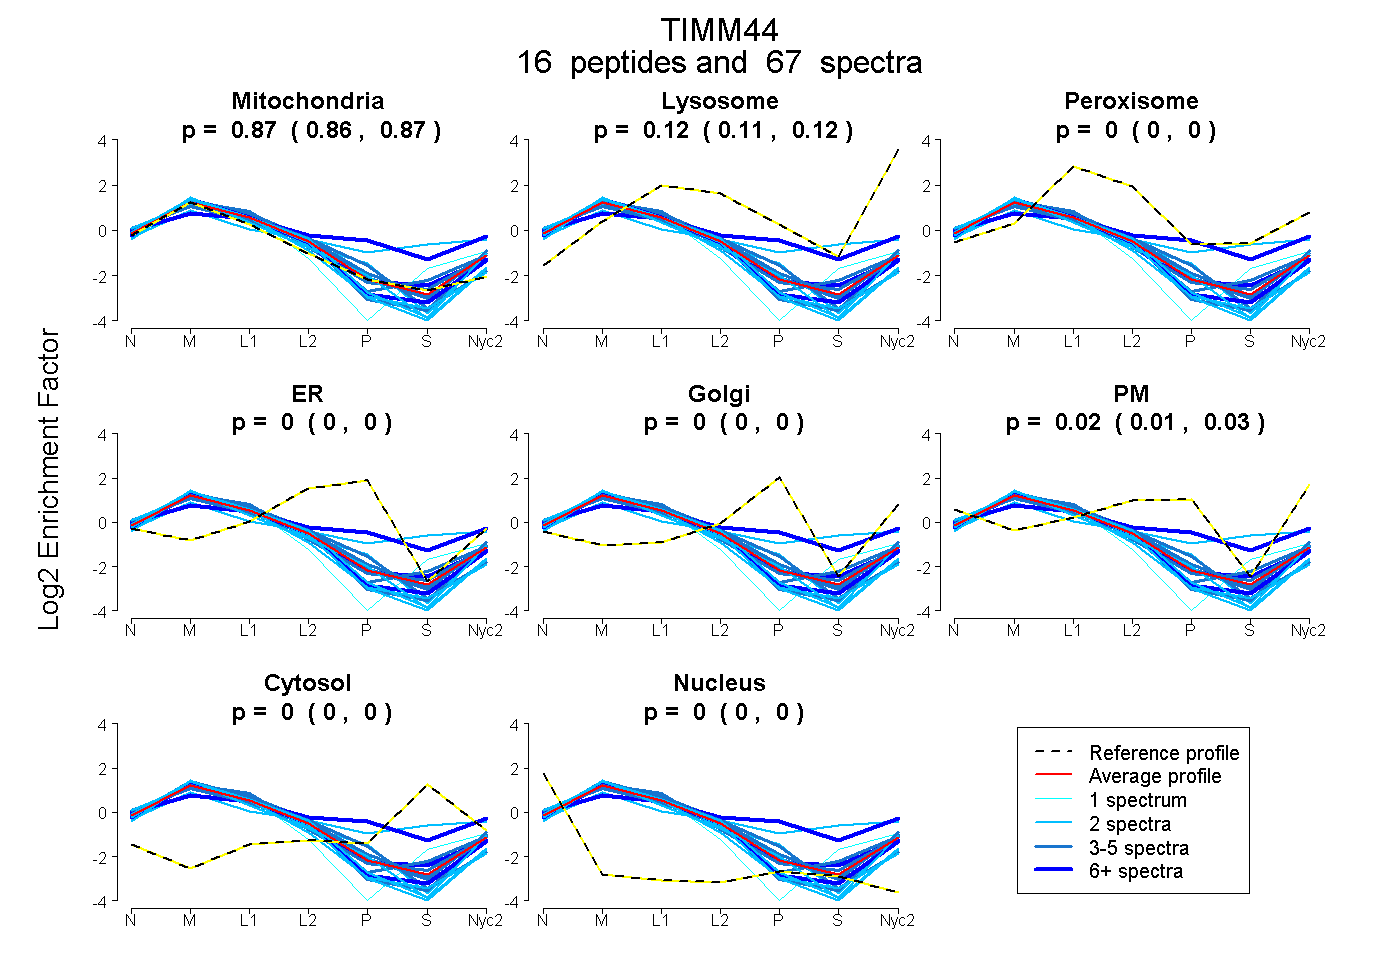
0.860 | 0.873
0.108 | 0.122
0.000 | 0.000
0.000 | 0.000
0.000 | 0.000
0.006 | 0.027
0.000 | 0.000
0.000 | 0.000
9peptides
spectra
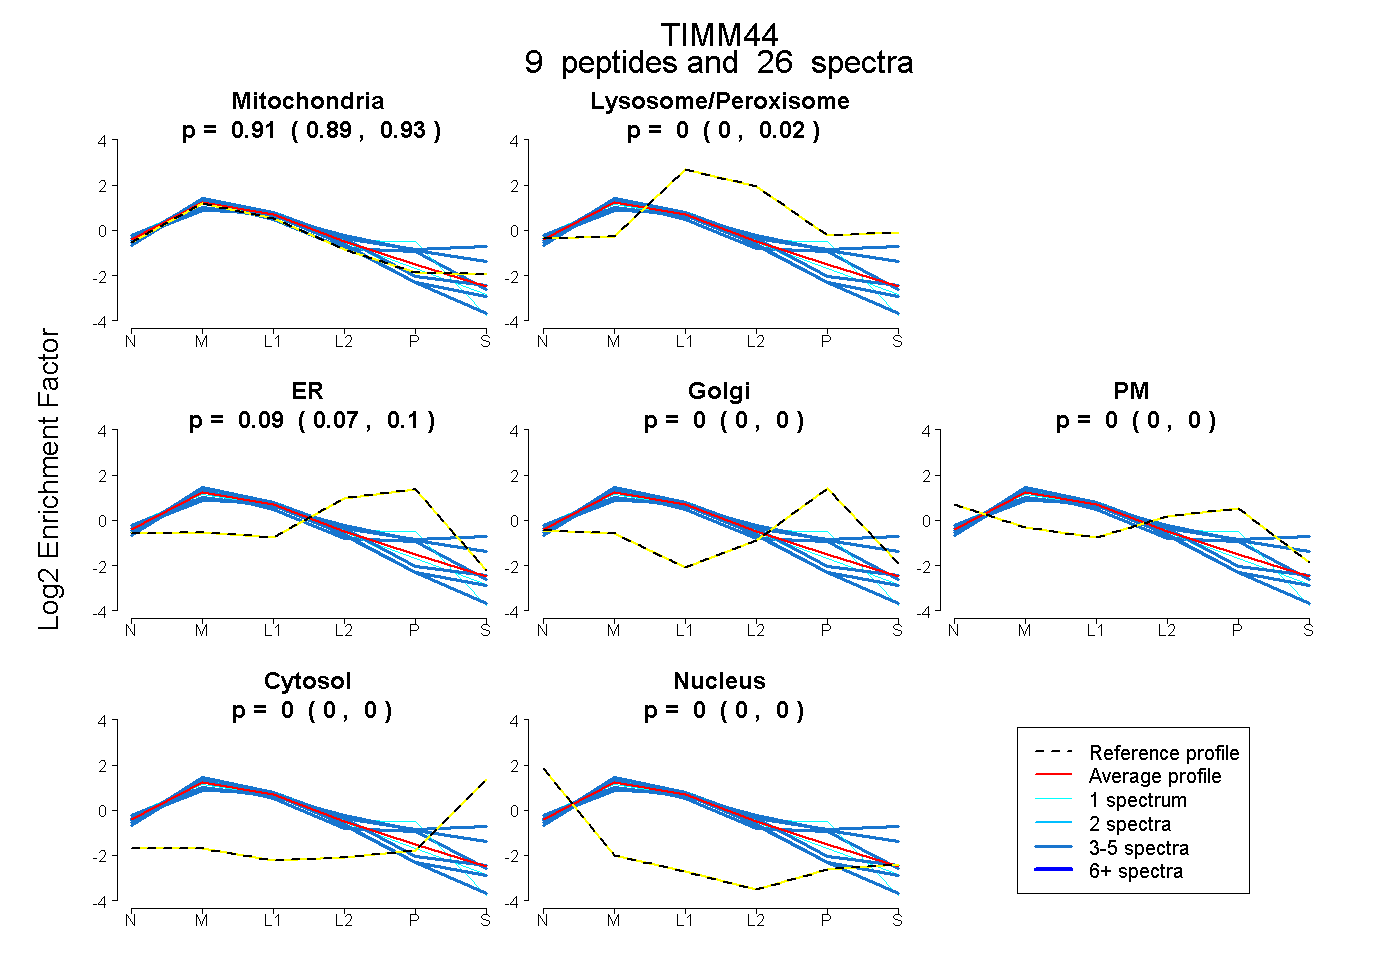
0.893 | 0.925
0.000 | 0.018
0.066 | 0.099
0.000 | 0.000
0.000 | 0.000
0.000 | 0.000
0.000 | 0.000
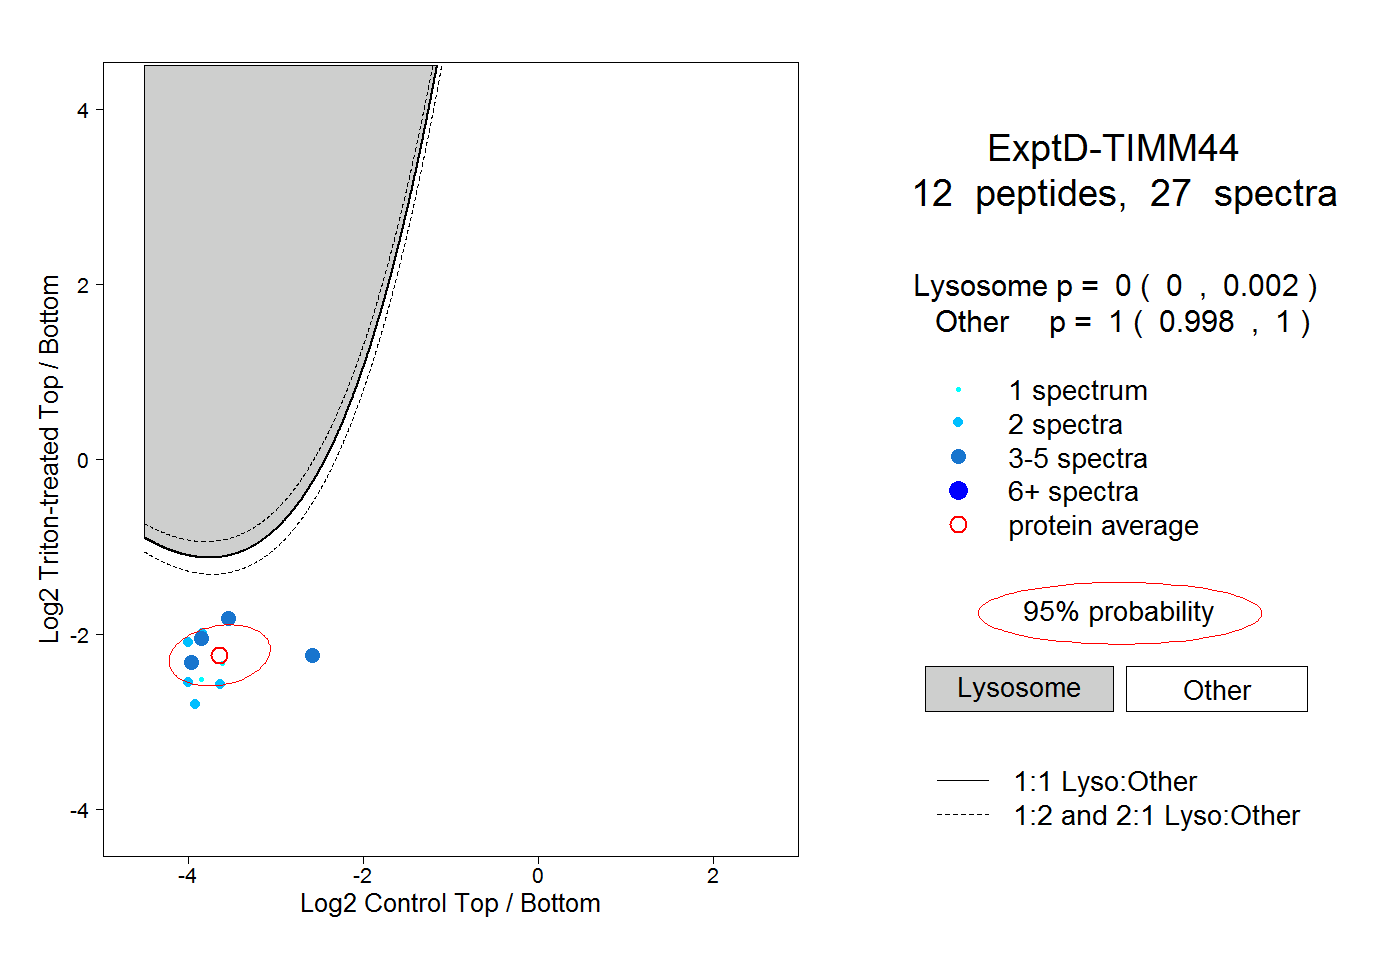
20peptides
spectra
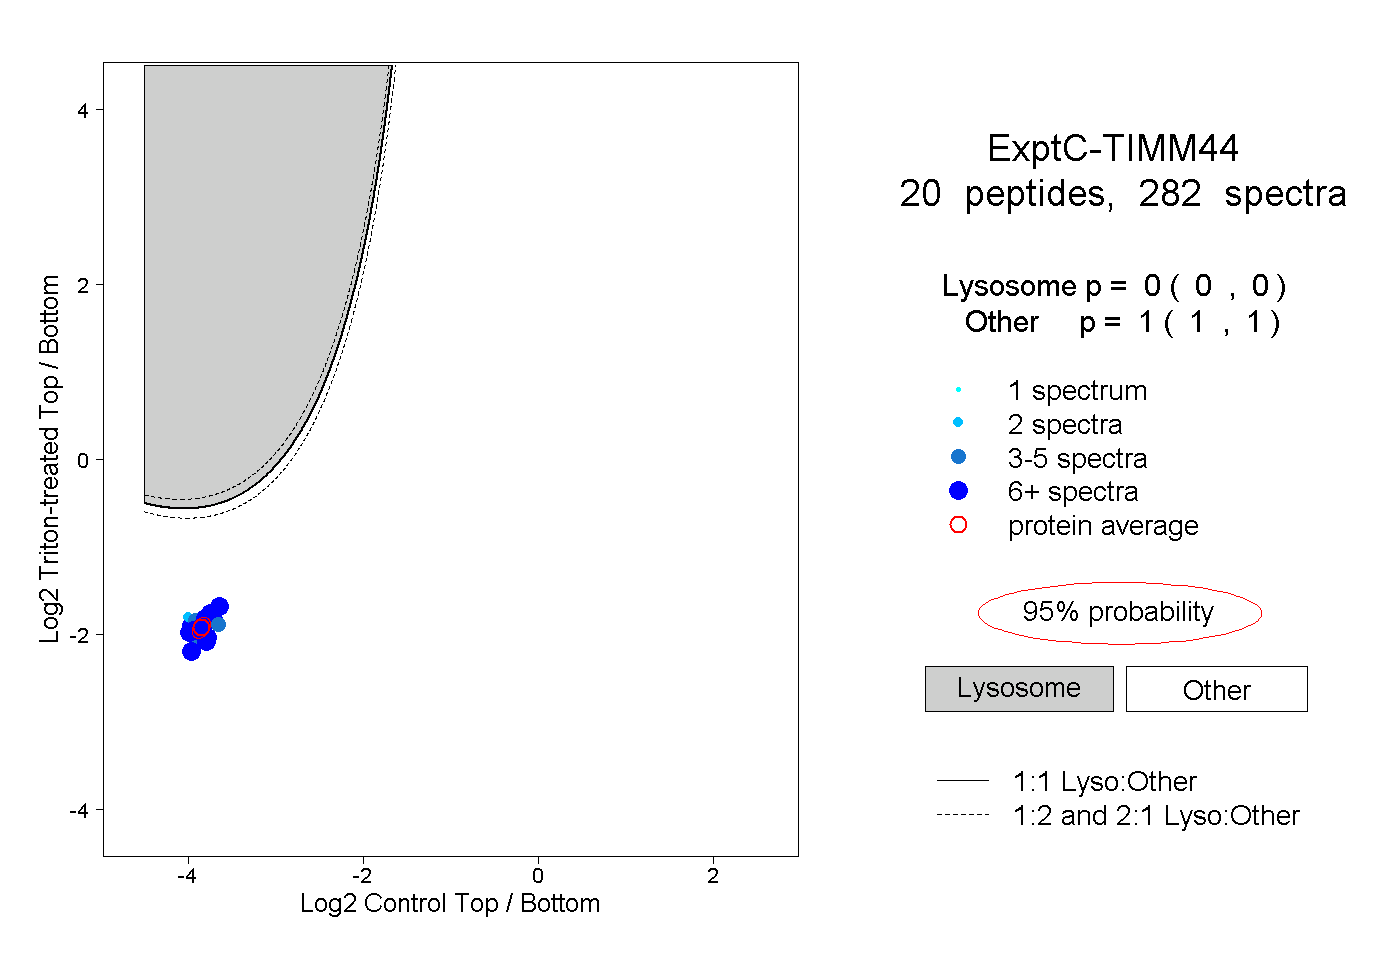
0.000 | 0.000
1.000 | 1.000