 16
16peptides
spectra
0.860 | 0.873
0.108 | 0.122
0.000 | 0.000
0.000 | 0.000
0.000 | 0.000
0.006 | 0.027
0.000 | 0.000
0.000 | 0.000
| Plot | Mito | Lyso | Perox | ER | Golgi | PM | Cytosol | Nucleus | |||||
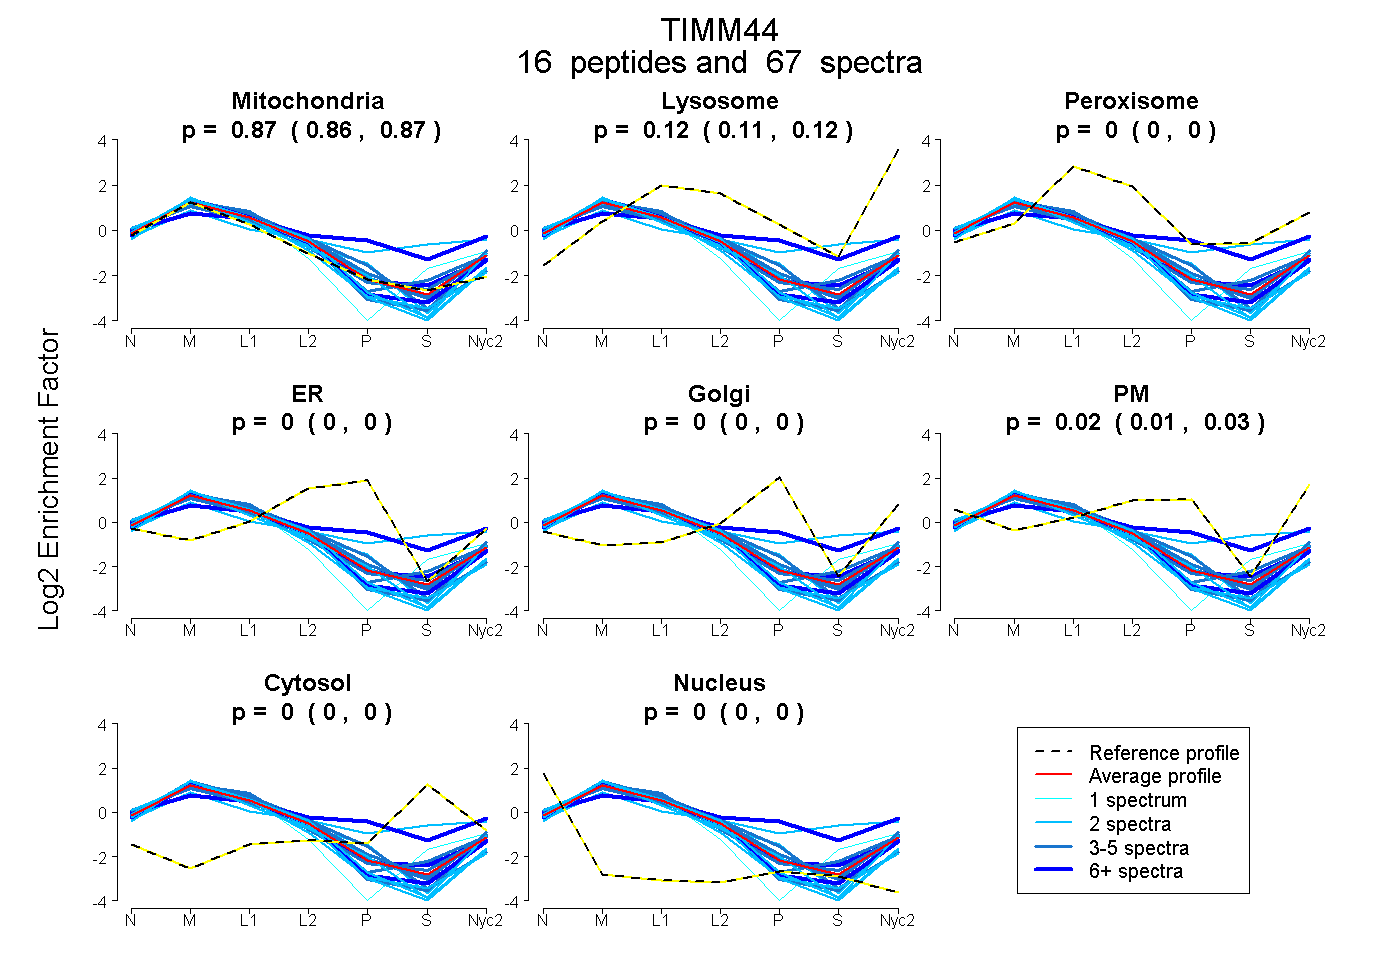
| Expt A |
16 peptides |
67 spectra |
|
0.867 0.860 | 0.873 |
0.116 0.108 | 0.122 |
0.000 0.000 | 0.000 |
0.000 0.000 | 0.000 |
0.000 0.000 | 0.000 |
0.017 0.006 | 0.027 |
0.000 0.000 | 0.000 |
0.000 0.000 | 0.000 |
| 8 spectra, TEMSEVLTEILR | 0.939 | 0.061 | 0.000 | 0.000 | 0.000 | 0.000 | 0.000 | 0.000 | ||
| 2 spectra, YDESDNVLIR | 1.000 | 0.000 | 0.000 | 0.000 | 0.000 | 0.000 | 0.000 | 0.000 | ||
| 3 spectra, ILDISNVDLAMGK | 0.909 | 0.091 | 0.000 | 0.000 | 0.000 | 0.000 | 0.000 | 0.000 | ||
| 3 spectra, GEVFDGDPDK | 0.805 | 0.052 | 0.107 | 0.000 | 0.000 | 0.000 | 0.000 | 0.036 | ||
| 3 spectra, MLYVWALCR | 0.845 | 0.000 | 0.000 | 0.155 | 0.000 | 0.000 | 0.000 | 0.000 | ||
| 5 spectra, TIESETVR | 0.818 | 0.085 | 0.000 | 0.000 | 0.000 | 0.097 | 0.000 | 0.000 | ||
| 5 spectra, DQEELNPYAAWR | 0.867 | 0.098 | 0.035 | 0.000 | 0.000 | 0.000 | 0.000 | 0.000 | ||
| 8 spectra, EIDESVLGHTGTYR | 0.409 | 0.012 | 0.223 | 0.000 | 0.109 | 0.163 | 0.084 | 0.000 | ||
| 2 spectra, GFLSGLLDNIK | 0.776 | 0.000 | 0.000 | 0.000 | 0.000 | 0.224 | 0.000 | 0.000 | ||
| 5 spectra, EGVEEAAR | 0.822 | 0.088 | 0.026 | 0.000 | 0.000 | 0.064 | 0.000 | 0.000 | ||
| 2 spectra, VTDLLGGLFSK | 0.913 | 0.087 | 0.000 | 0.000 | 0.000 | 0.000 | 0.000 | 0.000 | ||
| 2 spectra, VFEANEEALGVVLHK | 1.000 | 0.000 | 0.000 | 0.000 | 0.000 | 0.000 | 0.000 | 0.000 | ||
| 14 spectra, ALGLQFHSR | 0.850 | 0.058 | 0.088 | 0.000 | 0.000 | 0.000 | 0.000 | 0.004 | ||
| 2 spectra, DNNVVFNR | 0.460 | 0.141 | 0.096 | 0.000 | 0.000 | 0.070 | 0.234 | 0.000 | ||
| 1 spectrum, AISQGVESVK | 0.878 | 0.001 | 0.063 | 0.000 | 0.000 | 0.000 | 0.058 | 0.000 | ||
| 2 spectra, WYQQWK | 0.939 | 0.000 | 0.000 | 0.013 | 0.000 | 0.048 | 0.000 | 0.000 |
| Plot | Mito | Lyso or Perox | ER | Golgi | PM | Cytosol | Nucleus | ||||||
| Expt B |
9 peptides |
26 spectra |
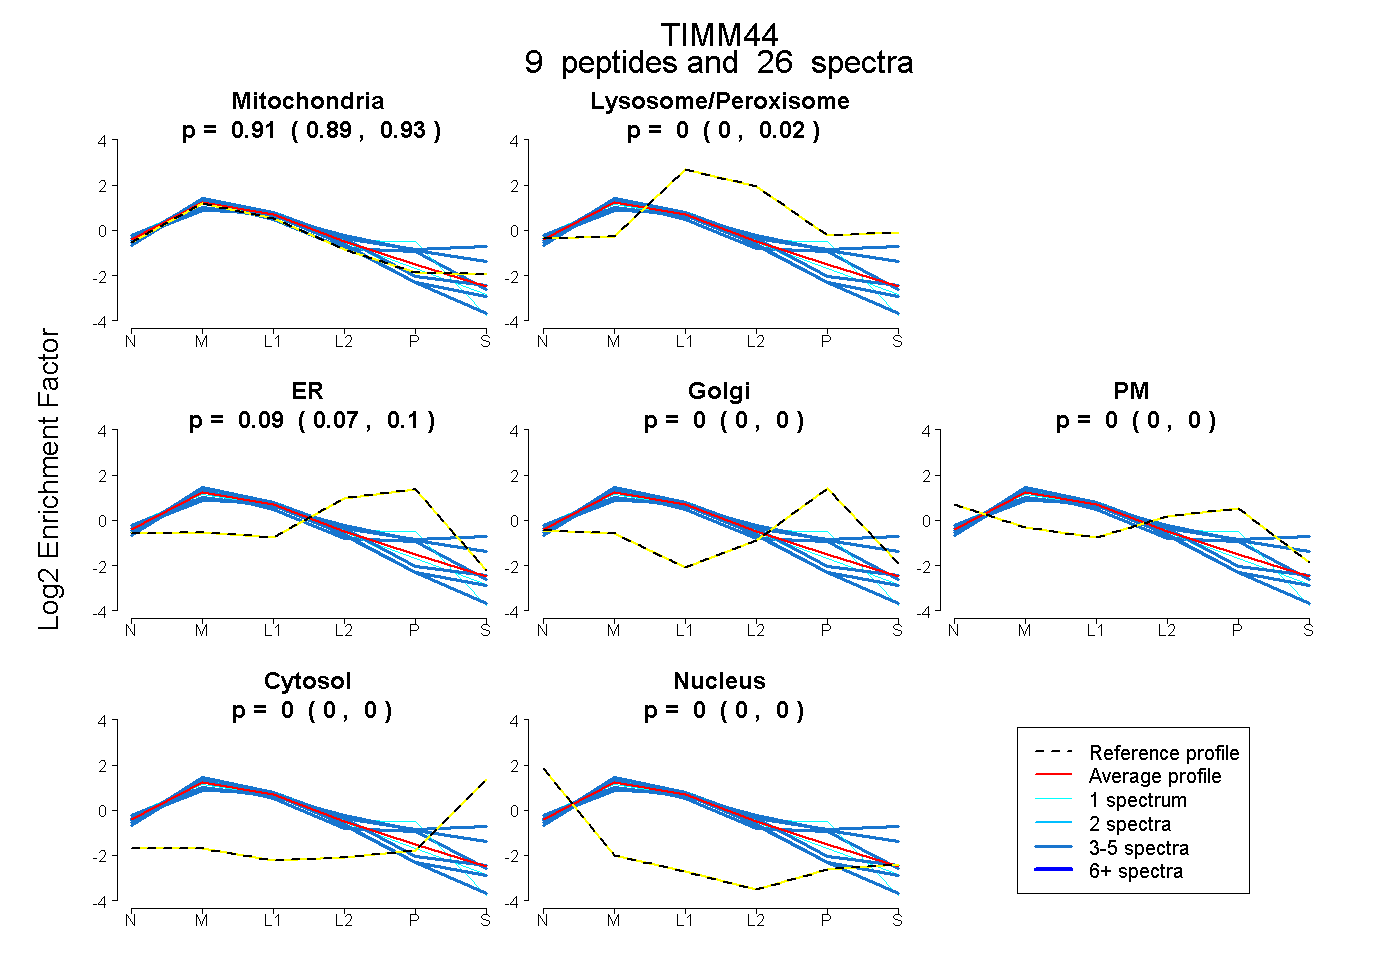 |
0.912 0.893 | 0.925 |
0.003 0.000 | 0.018 |
0.086 0.066 | 0.099 |
0.000 0.000 | 0.000 |
0.000 0.000 | 0.000 |
0.000 0.000 | 0.000 |
0.000 0.000 | 0.000 |
|||
| Plot | Lyso | Other | |||||||||||
| Expt C |
20 peptides |
282 spectra |
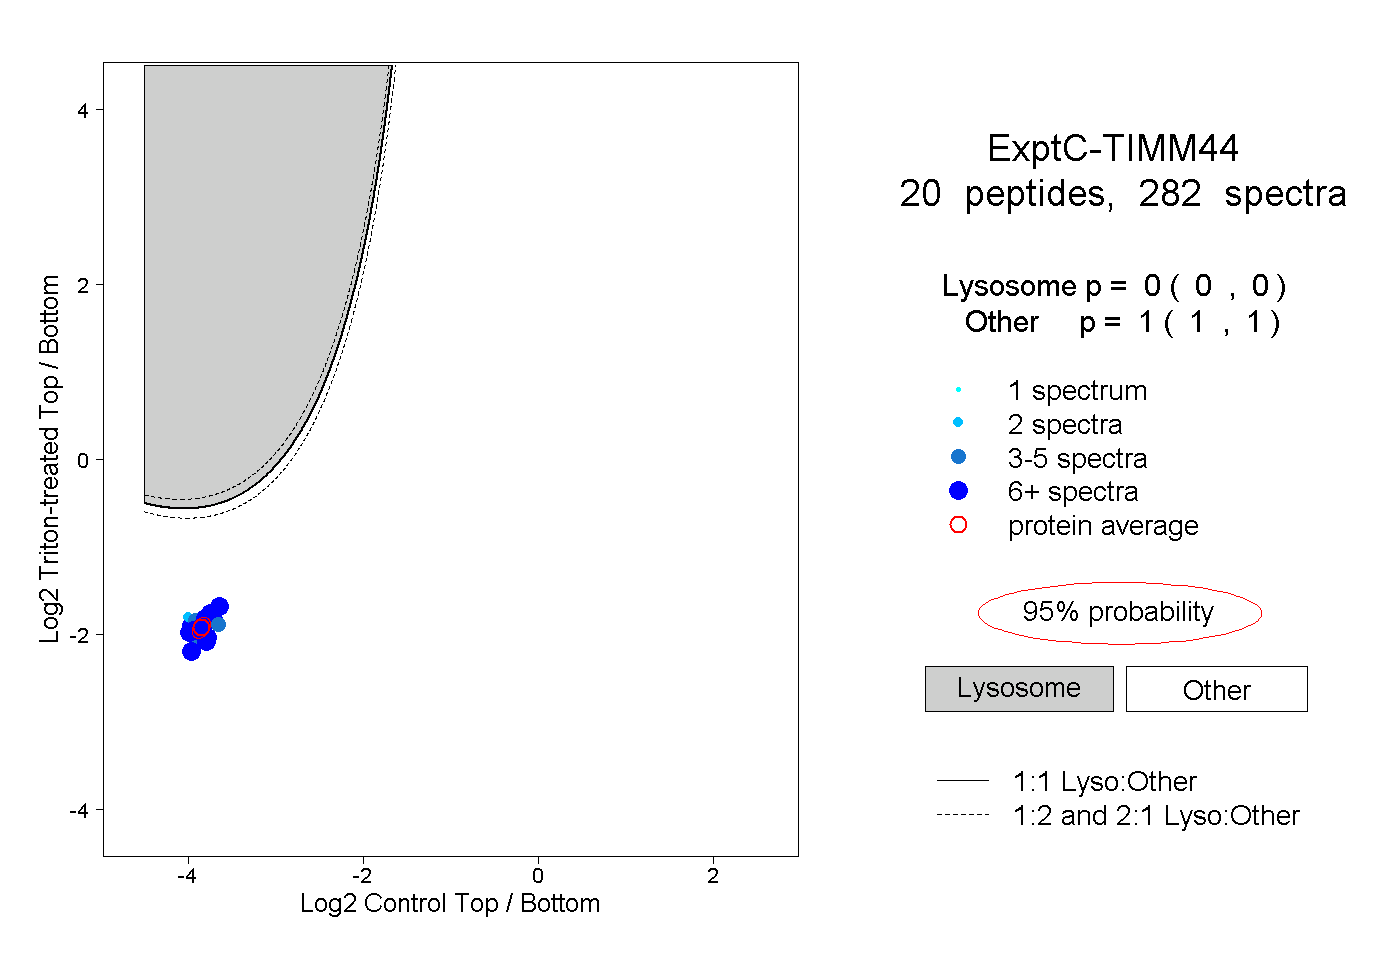 |
0.000 0.000 | 0.000 |
1.000 1.000 | 1.000 |
||||||||
| Plot | Lyso | Other | |||||||||||
| Expt D |
12 peptides |
27 spectra |
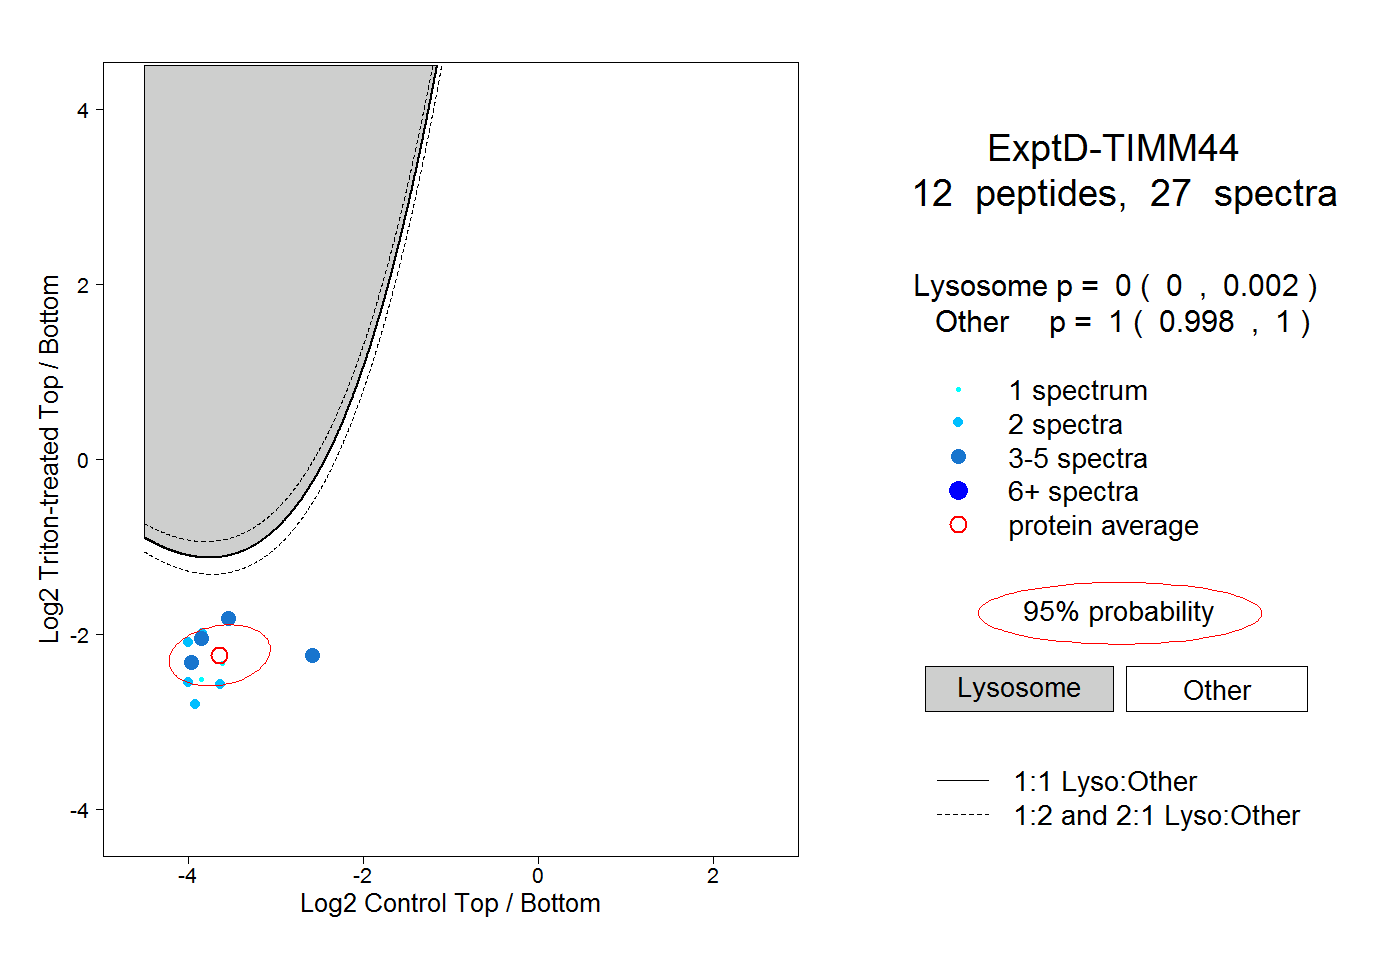 |
0.000 0.000 | 0.002 |
1.000 0.998 | 1.000 |