 3
3peptides
spectra
0.000 | 0.244
0.000 | 0.069
0.000 | 0.488
0.000 | 0.392
0.000 | 0.308
0.000 | 0.613
0.024 | 0.304
0.000 | 0.180
1peptide
spectrum
NA | NA
NA | NA
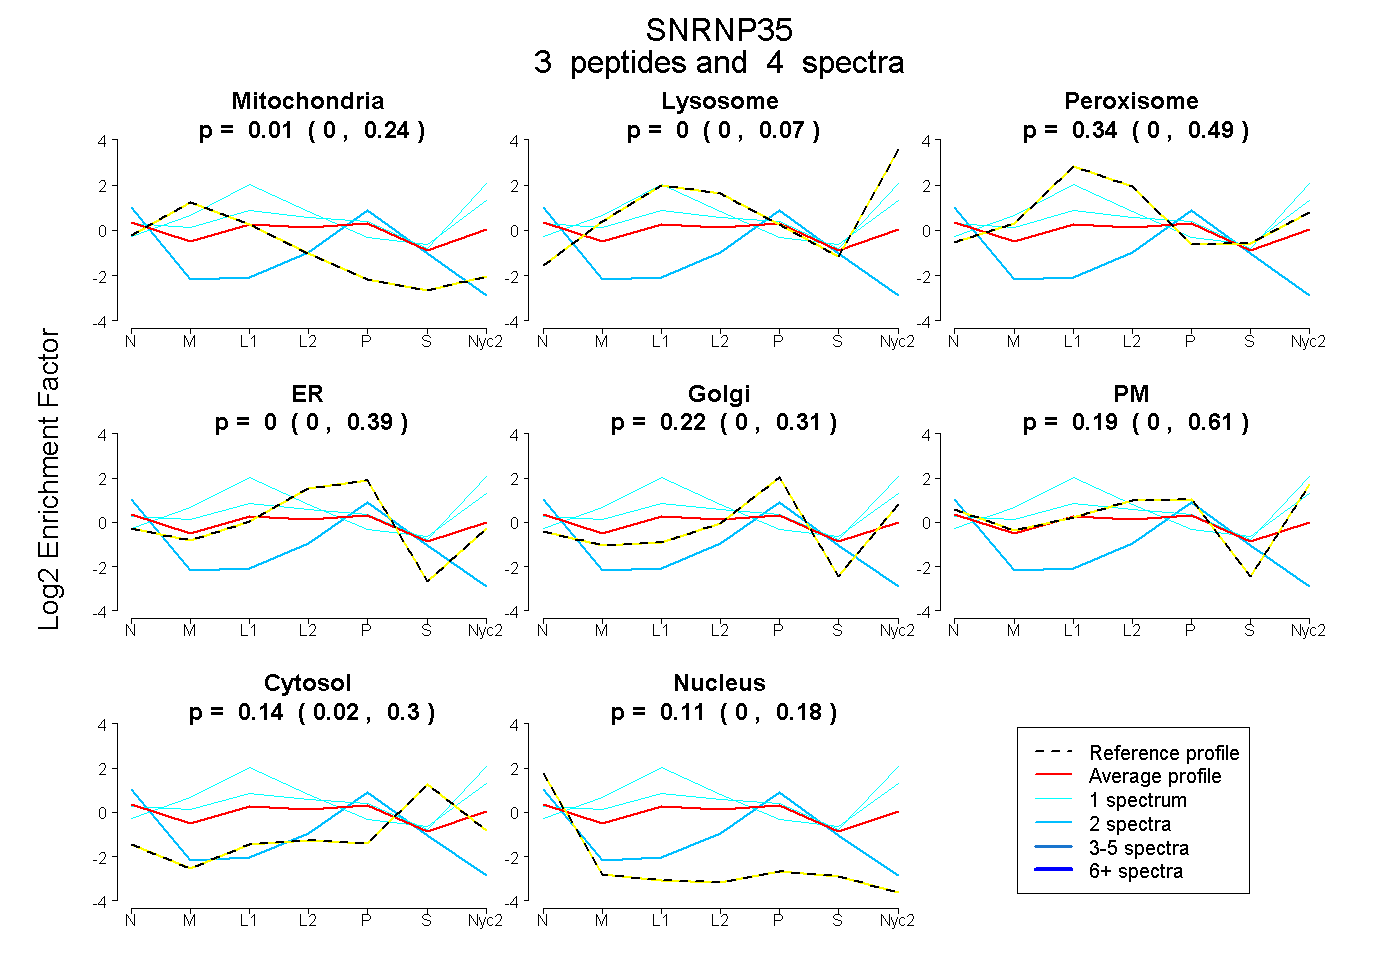
| Plot | Mito | Lyso | Perox | ER | Golgi | PM | Cytosol | Nucleus | |||||
| Expt A |
3 peptides |
4 spectra |
|
0.007 0.000 | 0.244 |
0.000 0.000 | 0.069 |
0.341 0.000 | 0.488 |
0.000 0.000 | 0.392 |
0.219 0.000 | 0.308 |
0.188 0.000 | 0.613 |
0.136 0.024 | 0.304 |
0.111 0.000 | 0.180 |
||
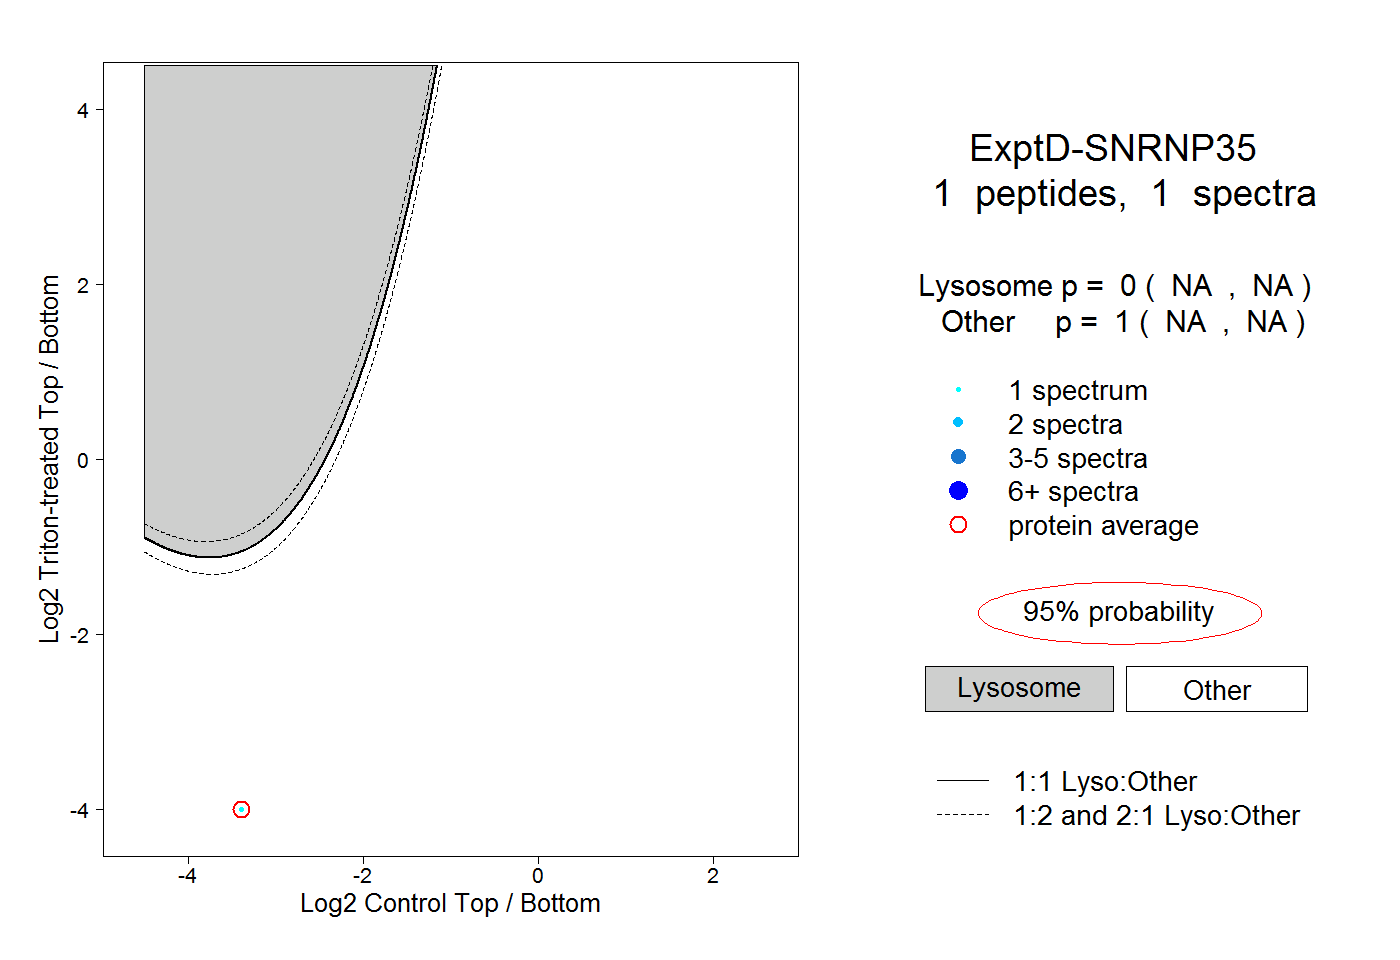
| Plot | Lyso | Other | |||||||||||
| Expt D |
1 peptide |
1 spectrum |
|
0.000 NA | NA |
1.000 NA | NA |