 3
3peptides
spectra
0.000 | 0.051
0.000 | 0.099
0.039 | 0.223
0.000 | 0.083
0.000 | 0.198
0.000 | 0.165
0.574 | 0.697
0.000 | 0.000
1peptide
spectrum
NA | NA
NA | NA
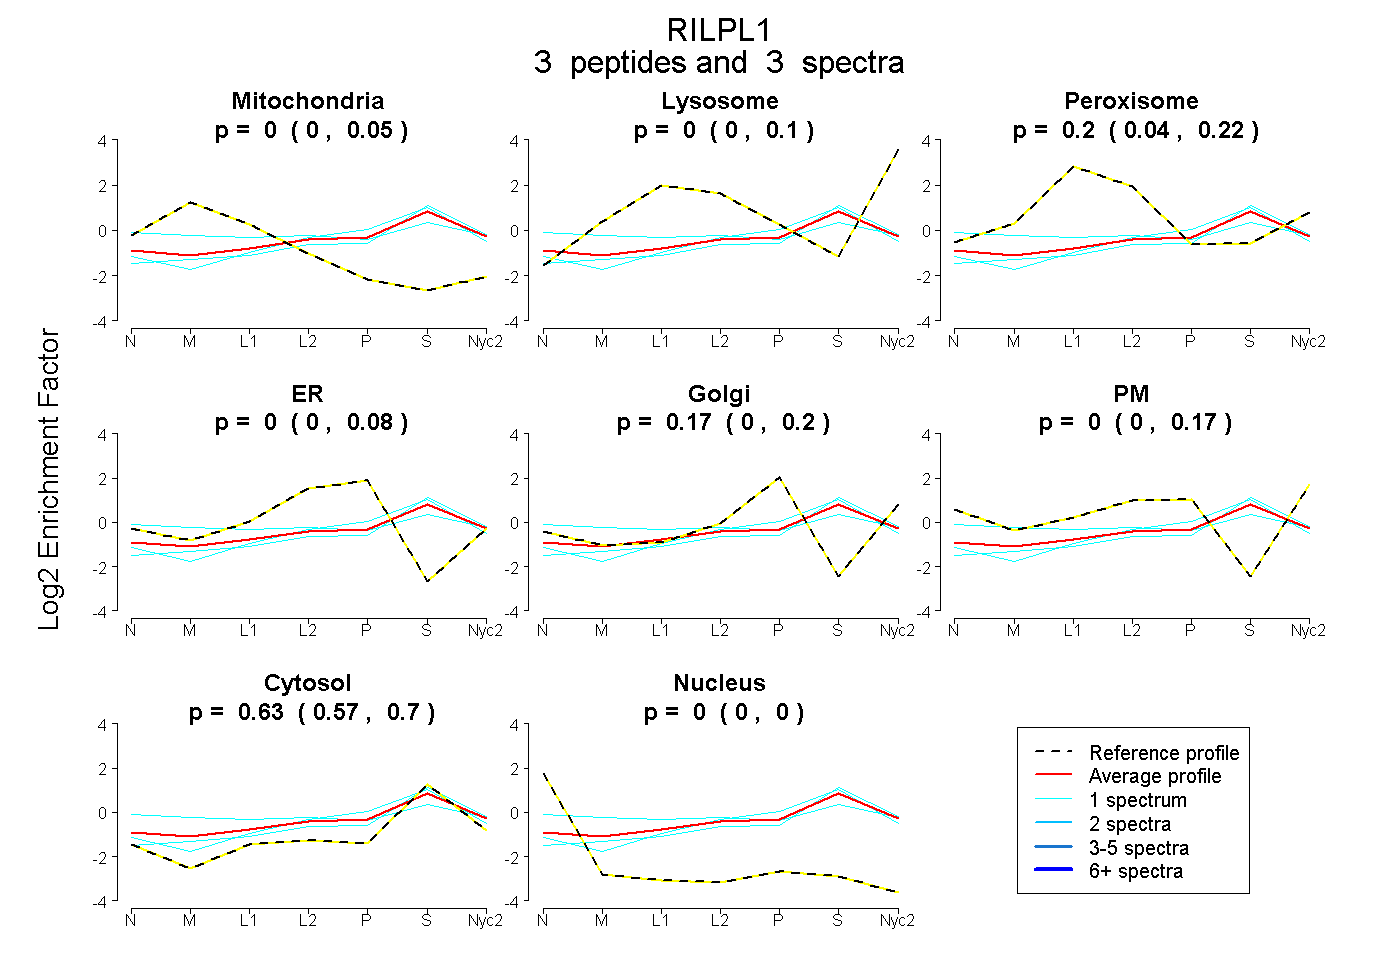
| Plot | Mito | Lyso | Perox | ER | Golgi | PM | Cytosol | Nucleus | |||||
| Expt A |
3 peptides |
3 spectra |
|
0.000 0.000 | 0.051 |
0.000 0.000 | 0.099 |
0.196 0.039 | 0.223 |
0.000 0.000 | 0.083 |
0.172 0.000 | 0.198 |
0.000 0.000 | 0.165 |
0.632 0.574 | 0.697 |
0.000 0.000 | 0.000 |
||
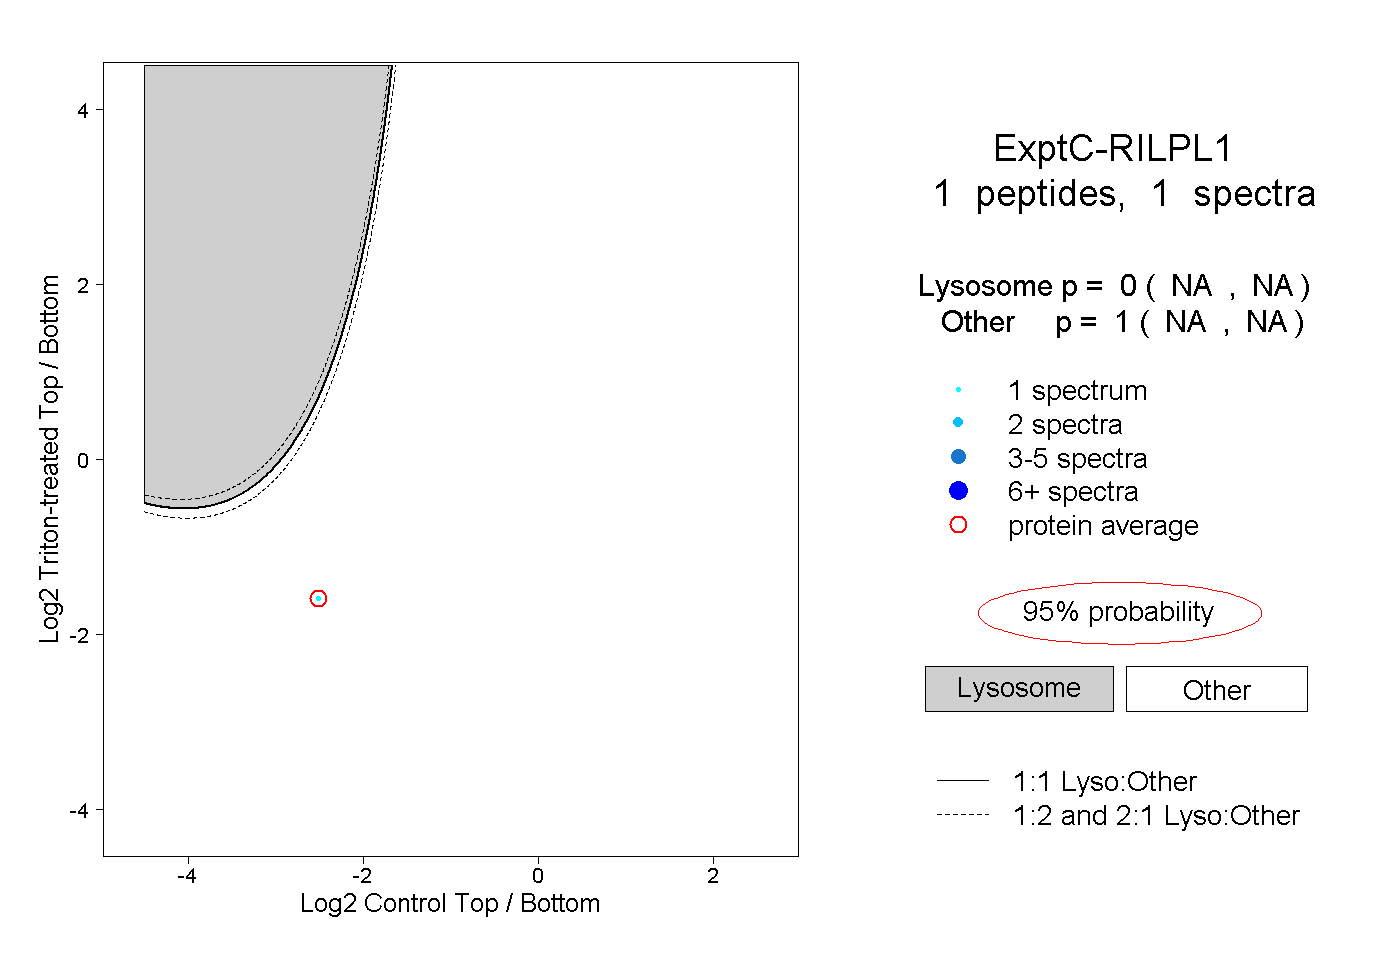
| Plot | Lyso | Other | |||||||||||
| Expt C |
1 peptide |
1 spectrum |
|
0.000 NA | NA |
1.000 NA | NA |