 5
5peptides
spectra
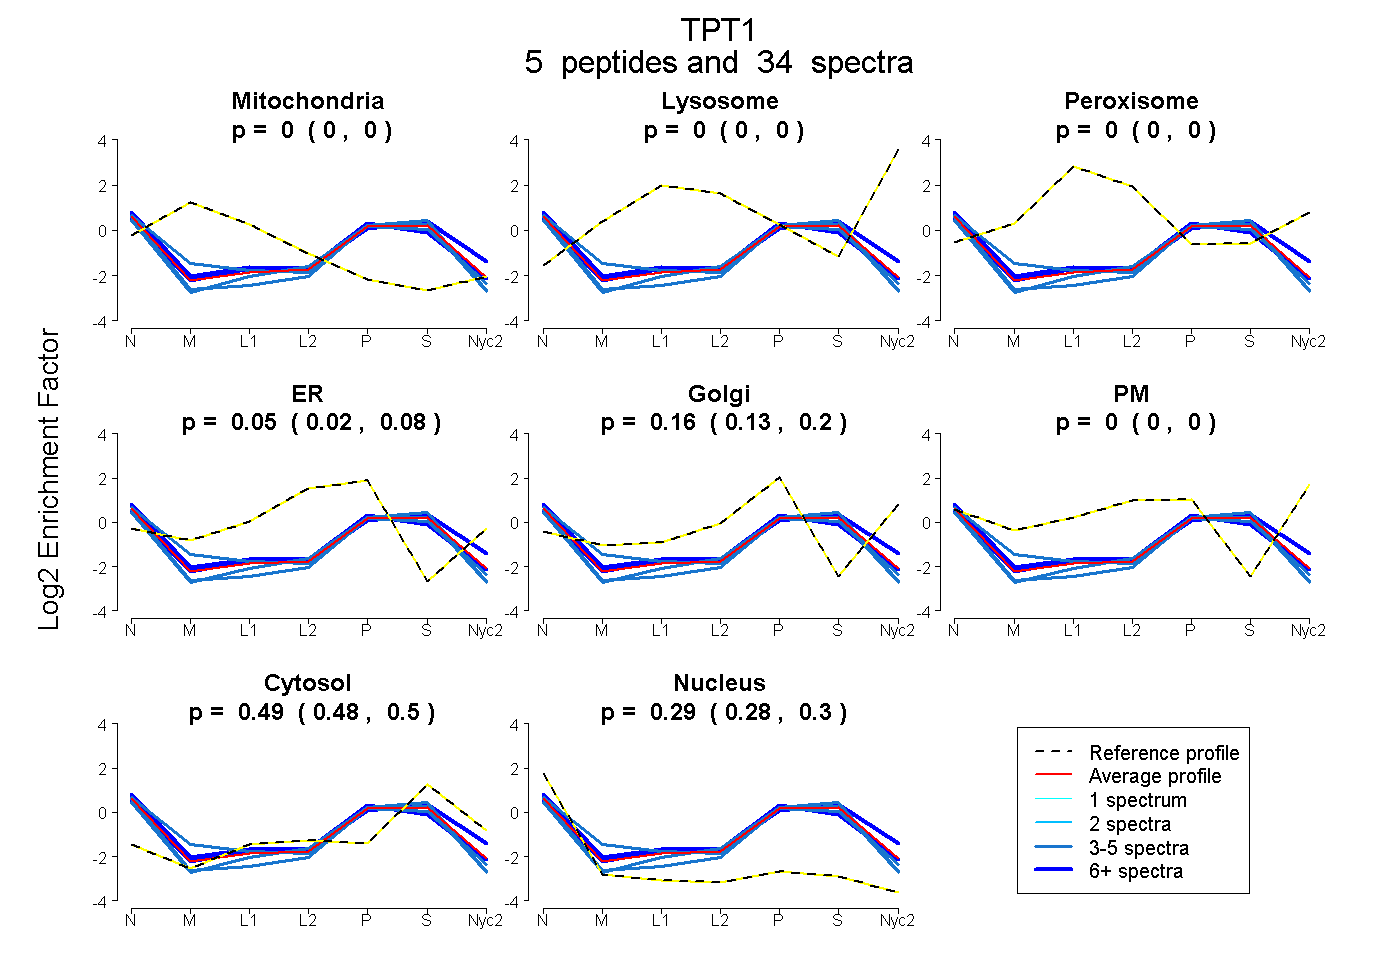
0.000 | 0.000
0.000 | 0.000
0.000 | 0.000
0.022 | 0.078
0.128 | 0.196
0.000 | 0.000
0.483 | 0.496
0.283 | 0.299
3peptides
spectra
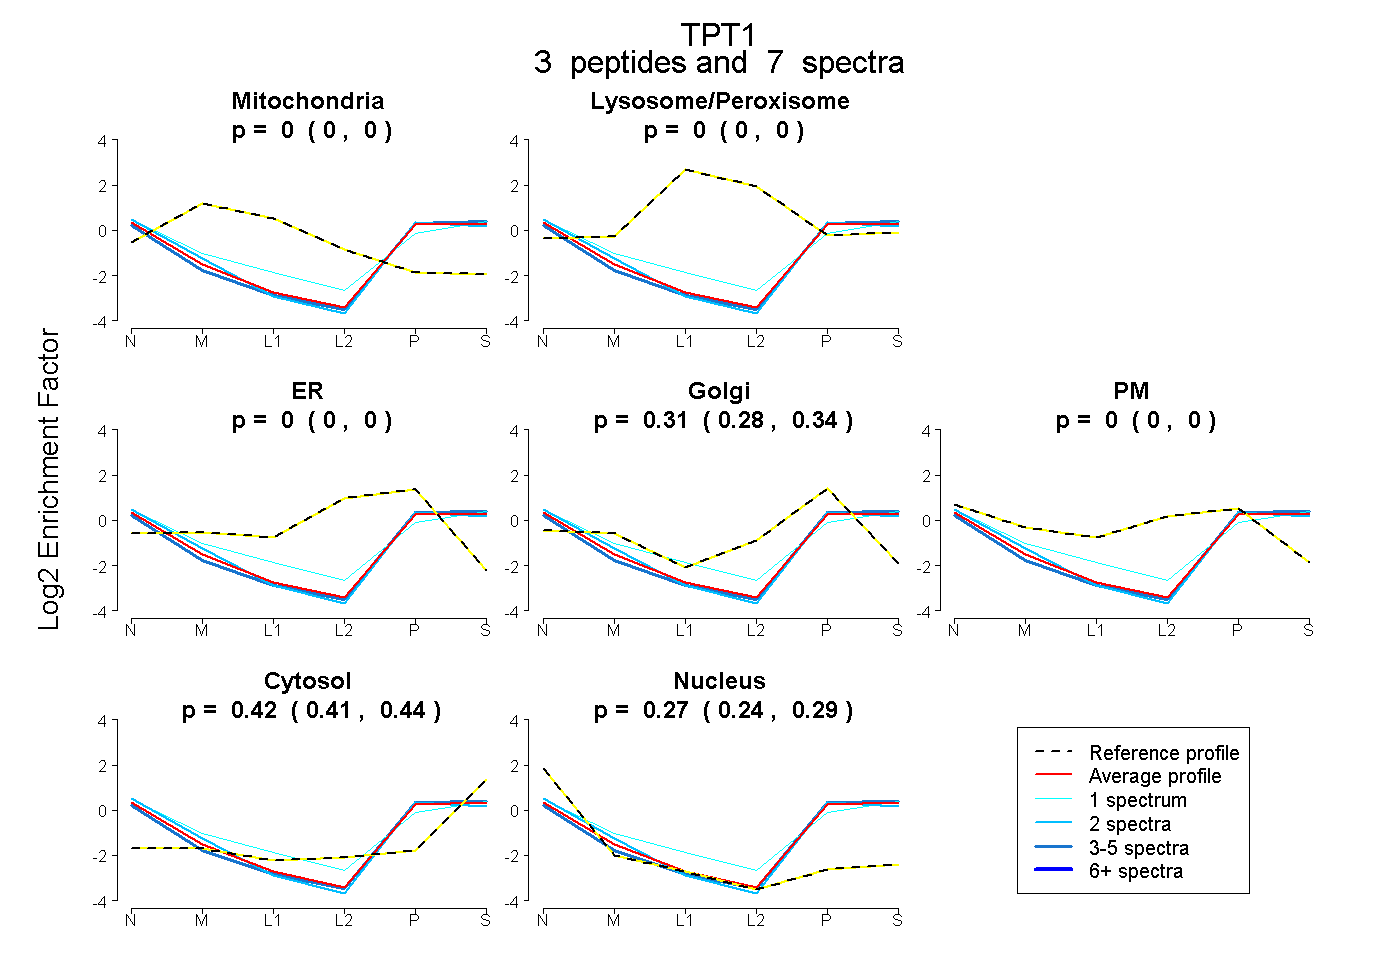
0.000 | 0.000
0.000 | 0.000
0.000 | 0.000
0.281 | 0.336
0.000 | 0.000
0.406 | 0.439
0.239 | 0.287
5peptides
spectra
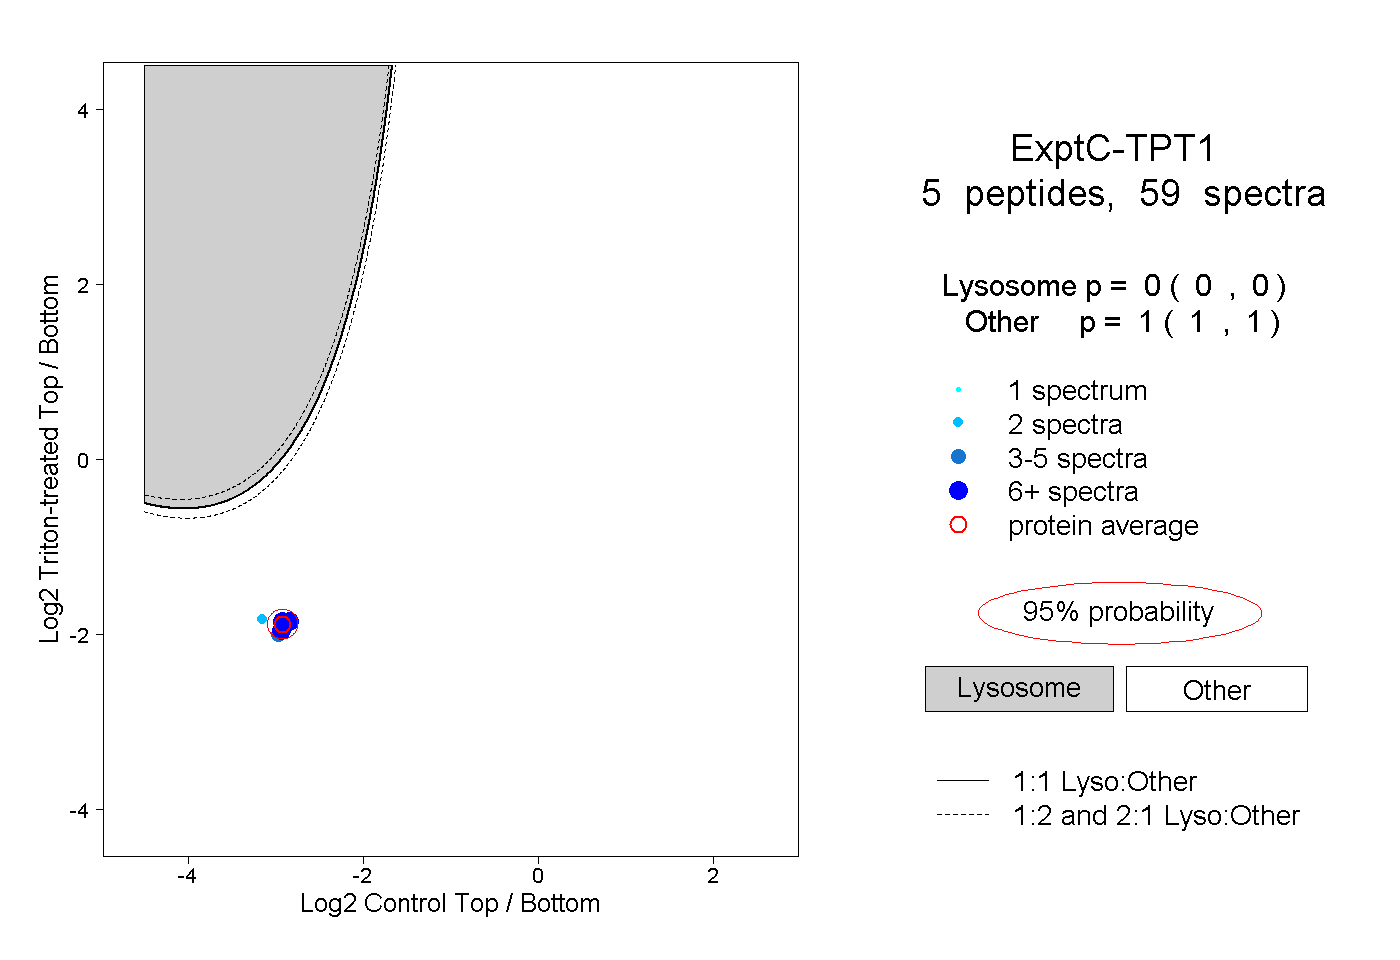
0.000 | 0.000
1.000 | 1.000
3peptides
spectra
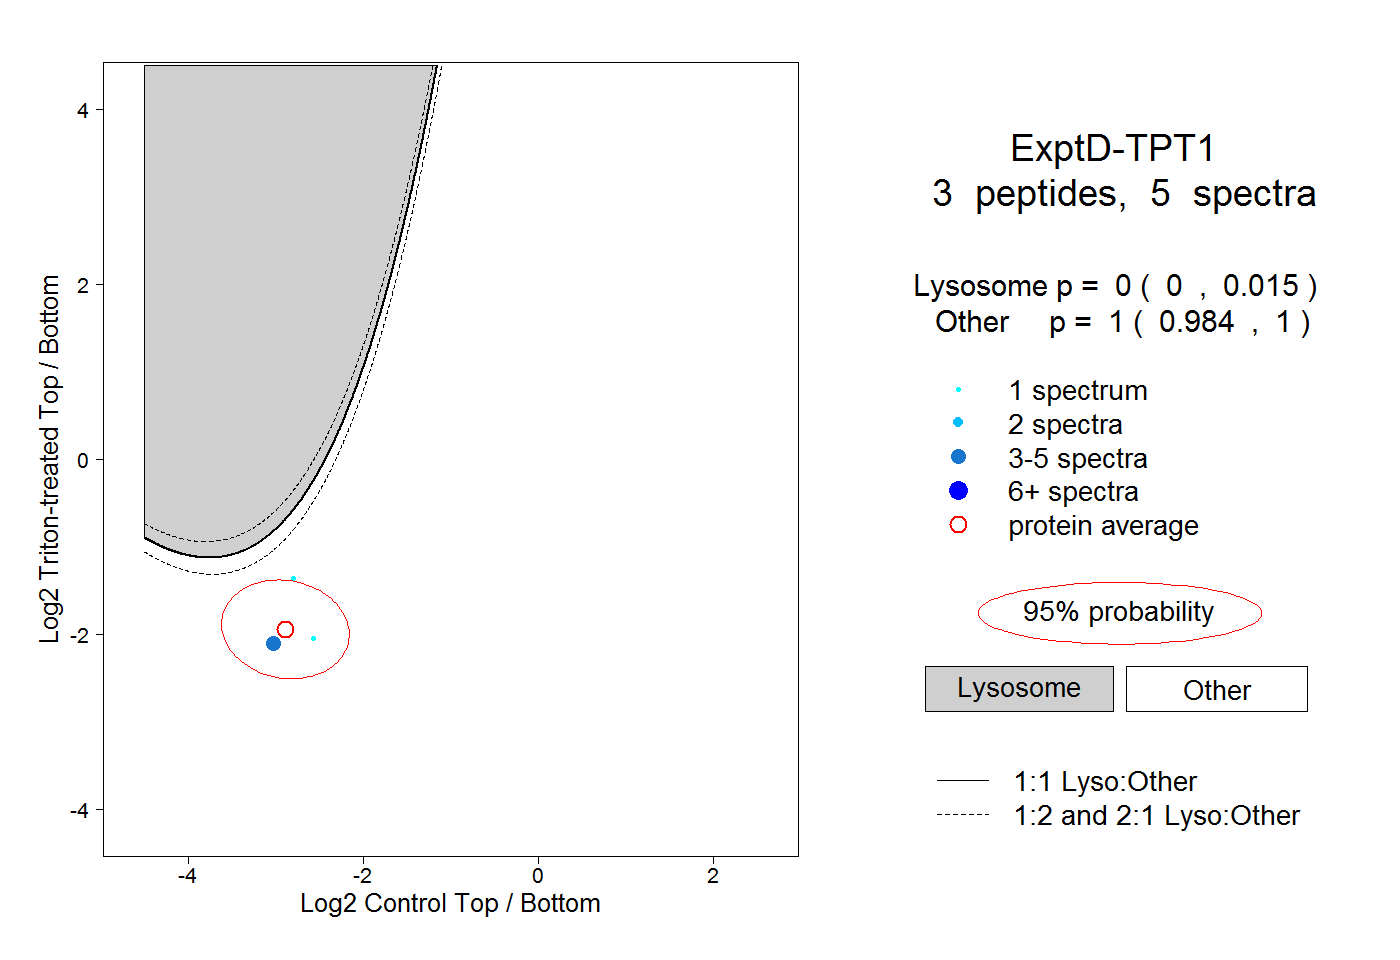
0.000 | 0.015
0.984 | 1.000