 7
7peptides
spectra
0.000 | 0.000
0.000 | 0.000
0.000 | 0.016
0.000 | 0.071
0.007 | 0.091
0.000 | 0.000
0.893 | 0.919
0.000 | 0.000
| Plot | Mito | Lyso | Perox | ER | Golgi | PM | Cytosol | Nucleus | |||||
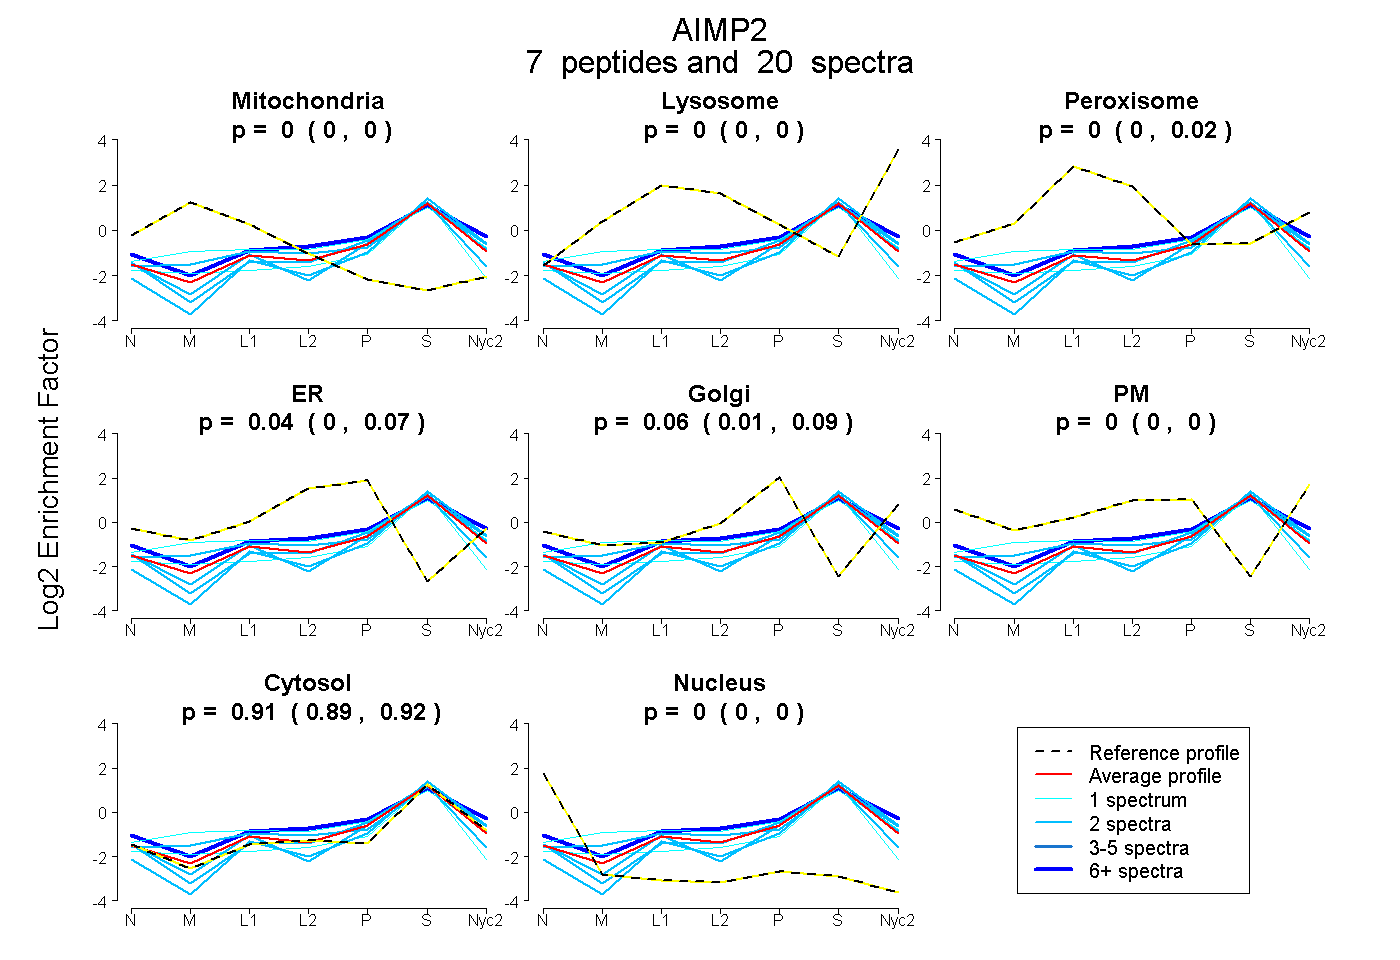
| Expt A |
7 peptides |
20 spectra |
|
0.000 0.000 | 0.000 |
0.000 0.000 | 0.000 |
0.000 0.000 | 0.016 |
0.035 0.000 | 0.071 |
0.055 0.007 | 0.091 |
0.000 0.000 | 0.000 |
0.910 0.893 | 0.919 |
0.000 0.000 | 0.000 |
| 2 spectra, TTSPATDAGHVQEPSEPSLR | 0.000 | 0.000 | 0.000 | 0.000 | 0.000 | 0.000 | 0.943 | 0.057 | ||
| 2 spectra, LPNVHSK | 0.000 | 0.000 | 0.000 | 0.000 | 0.061 | 0.000 | 0.939 | 0.000 | ||
| 1 spectrum, FSVQTMCPIEGEGNIAR | 0.044 | 0.000 | 0.000 | 0.000 | 0.000 | 0.000 | 0.904 | 0.052 | ||
| 2 spectra, DYGALK | 0.031 | 0.072 | 0.047 | 0.000 | 0.026 | 0.000 | 0.824 | 0.000 | ||
| 10 spectra, CFGEQAR | 0.000 | 0.043 | 0.071 | 0.000 | 0.131 | 0.000 | 0.755 | 0.000 | ||
| 2 spectra, VELPTCMYR | 0.000 | 0.000 | 0.000 | 0.000 | 0.000 | 0.000 | 1.000 | 0.000 | ||
| 1 spectrum, SMNSALGK | 0.066 | 0.000 | 0.135 | 0.000 | 0.104 | 0.000 | 0.694 | 0.000 |
| Plot | Mito | Lyso or Perox | ER | Golgi | PM | Cytosol | Nucleus | ||||||
| Expt B |
2 peptides |
2 spectra |
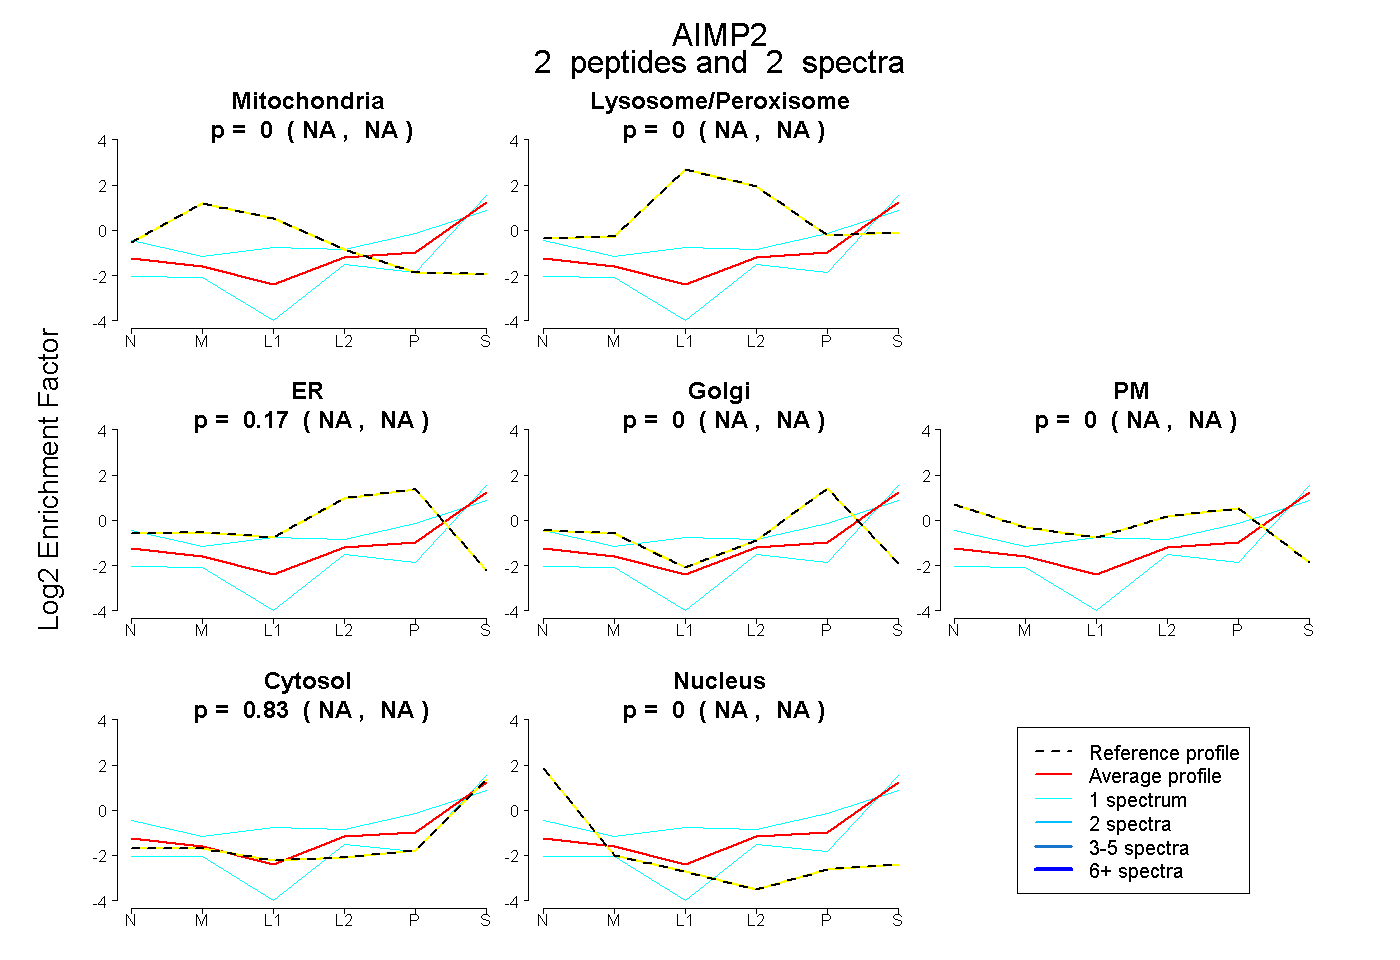 |
0.000 NA | NA |
0.000 NA | NA |
0.165 NA | NA |
0.000 NA | NA |
0.000 NA | NA |
0.835 NA | NA |
0.000 NA | NA |
|||
| Plot | Lyso | Other | |||||||||||
| Expt C |
5 peptides |
12 spectra |
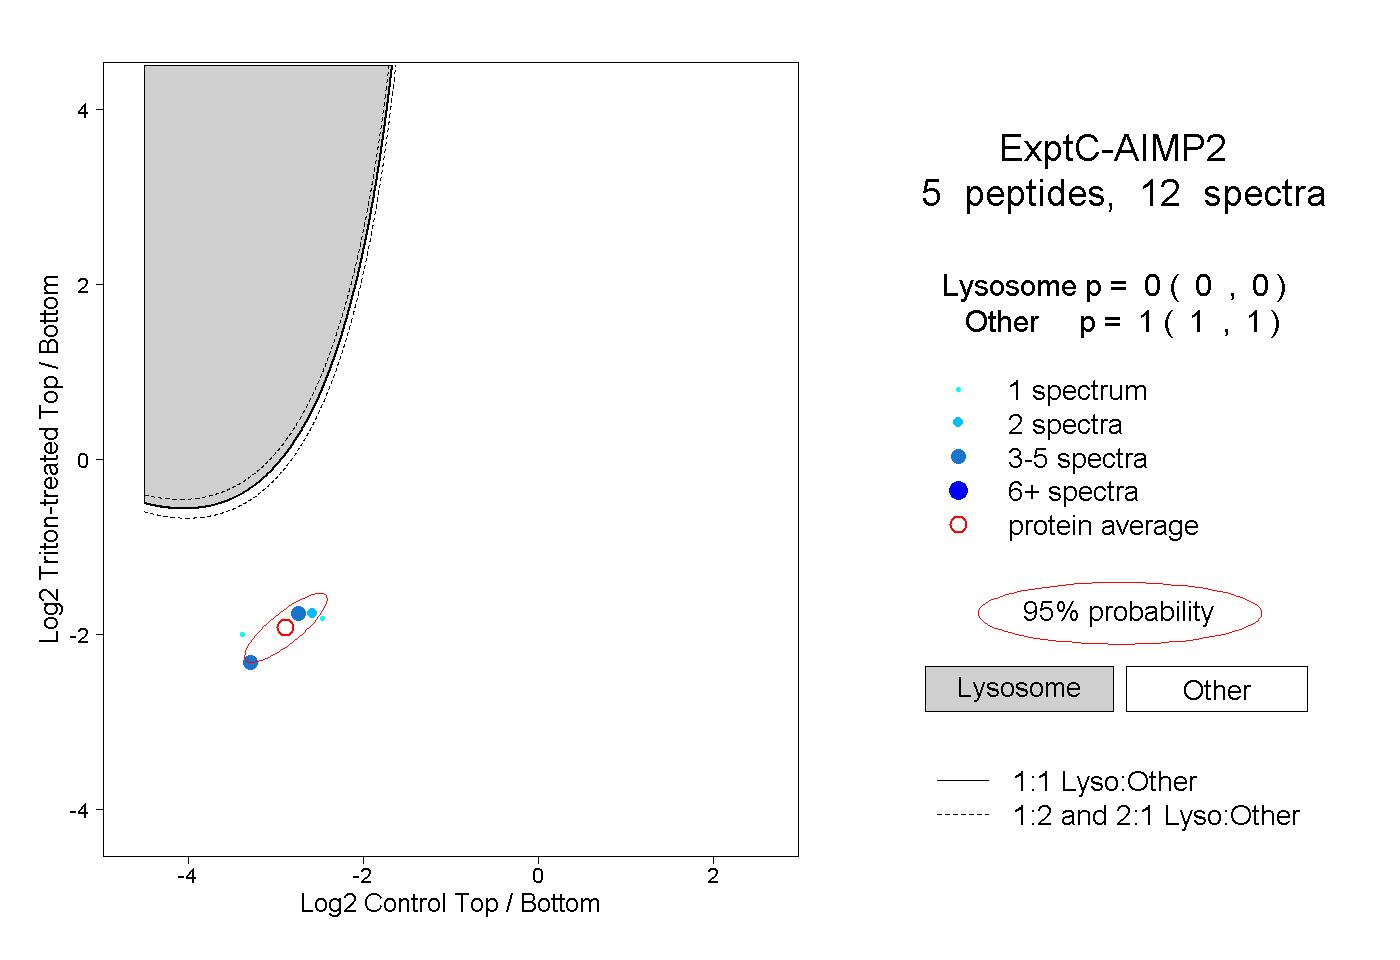 |
0.000 0.000 | 0.000 |
1.000 1.000 | 1.000 |