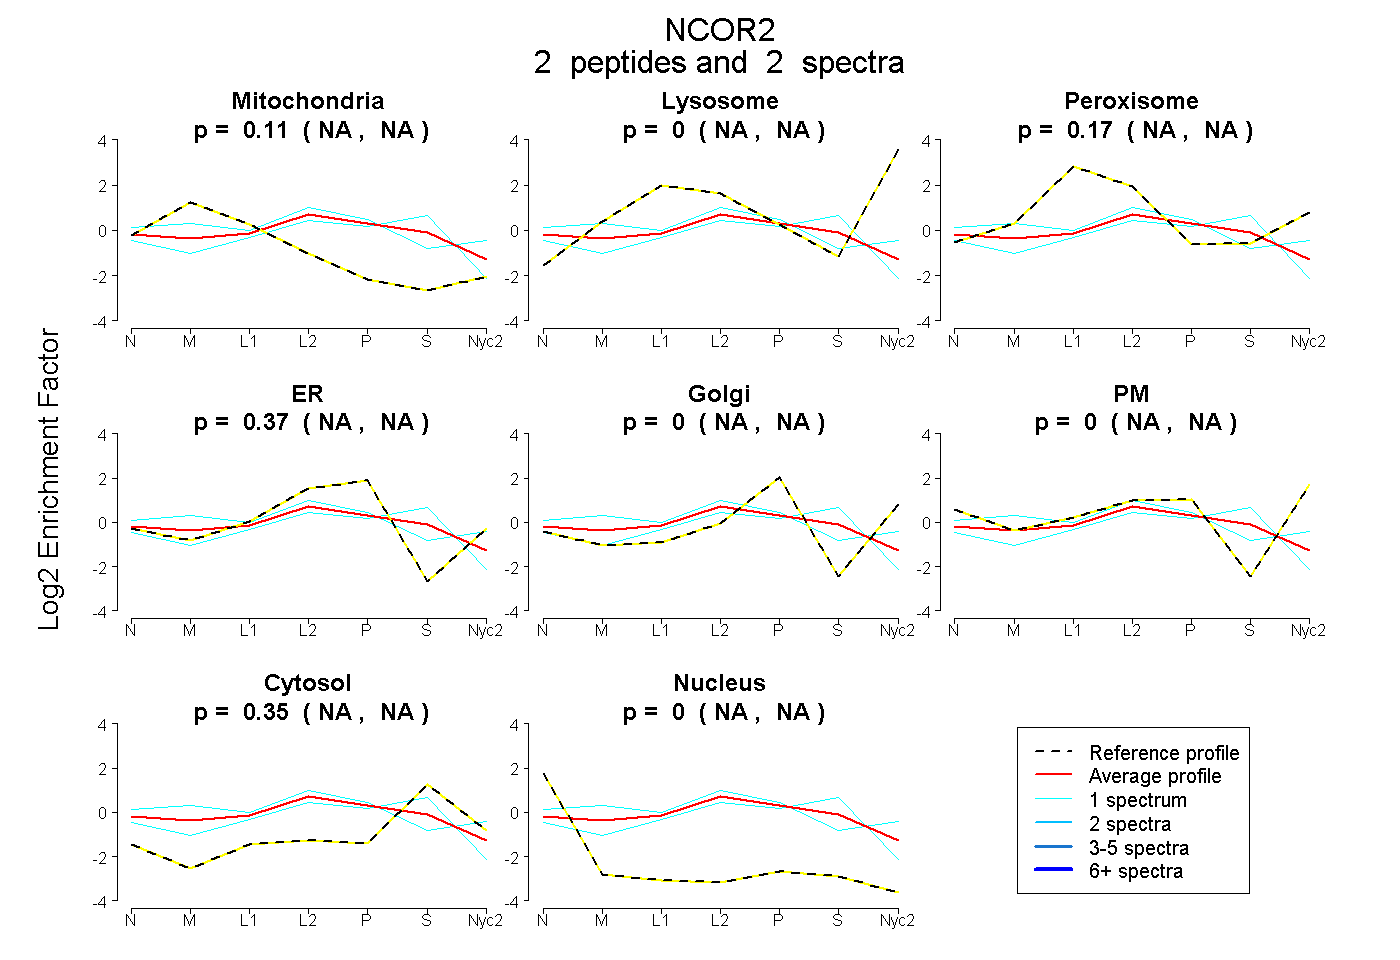
 2
2peptides
spectra
NA | NA
NA | NA
NA | NA
NA | NA
NA | NA
NA | NA
NA | NA
NA | NA
| Plot | Mito | Lyso | Perox | ER | Golgi | PM | Cytosol | Nucleus | |||||
| Expt A |
2 peptides |
2 spectra |
|
0.108 NA | NA |
0.000 NA | NA |
0.173 NA | NA |
0.372 NA | NA |
0.000 NA | NA |
0.000 NA | NA |
0.347 NA | NA |
0.000 NA | NA |
| 1 spectrum, APMGPLTMGLPLAVDPK | 0.067 | 0.000 | 0.102 | 0.297 | 0.000 | 0.000 | 0.535 | 0.000 | ||
| 1 spectrum, GLLEHGR | 0.150 | 0.000 | 0.220 | 0.374 | 0.000 | 0.098 | 0.158 | 0.000 |
| Plot | Lyso | Other | |||||||||||
| Expt C |
1 peptide |
4 spectra |
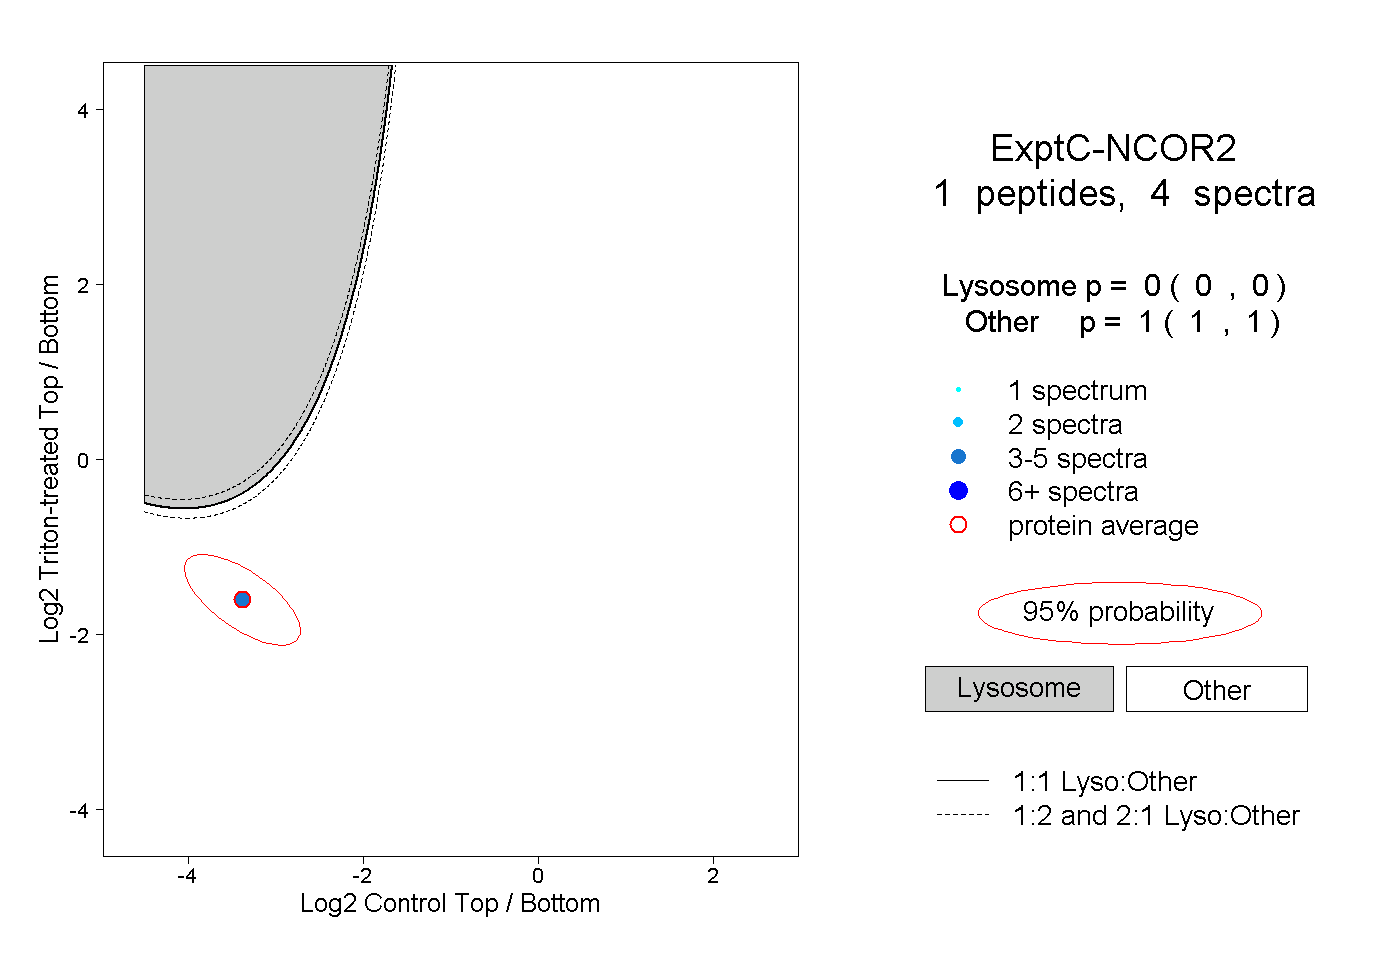 |
0.000 0.000 | 0.000 |
1.000 1.000 | 1.000 |