 4
4peptides
spectra
0.000 | 0.000
0.000 | 0.105
0.000 | 0.118
0.000 | 0.017
0.162 | 0.284
0.000 | 0.076
0.586 | 0.651
0.000 | 0.000
4peptides
spectra
0.000 | 0.000
1.000 | 1.000
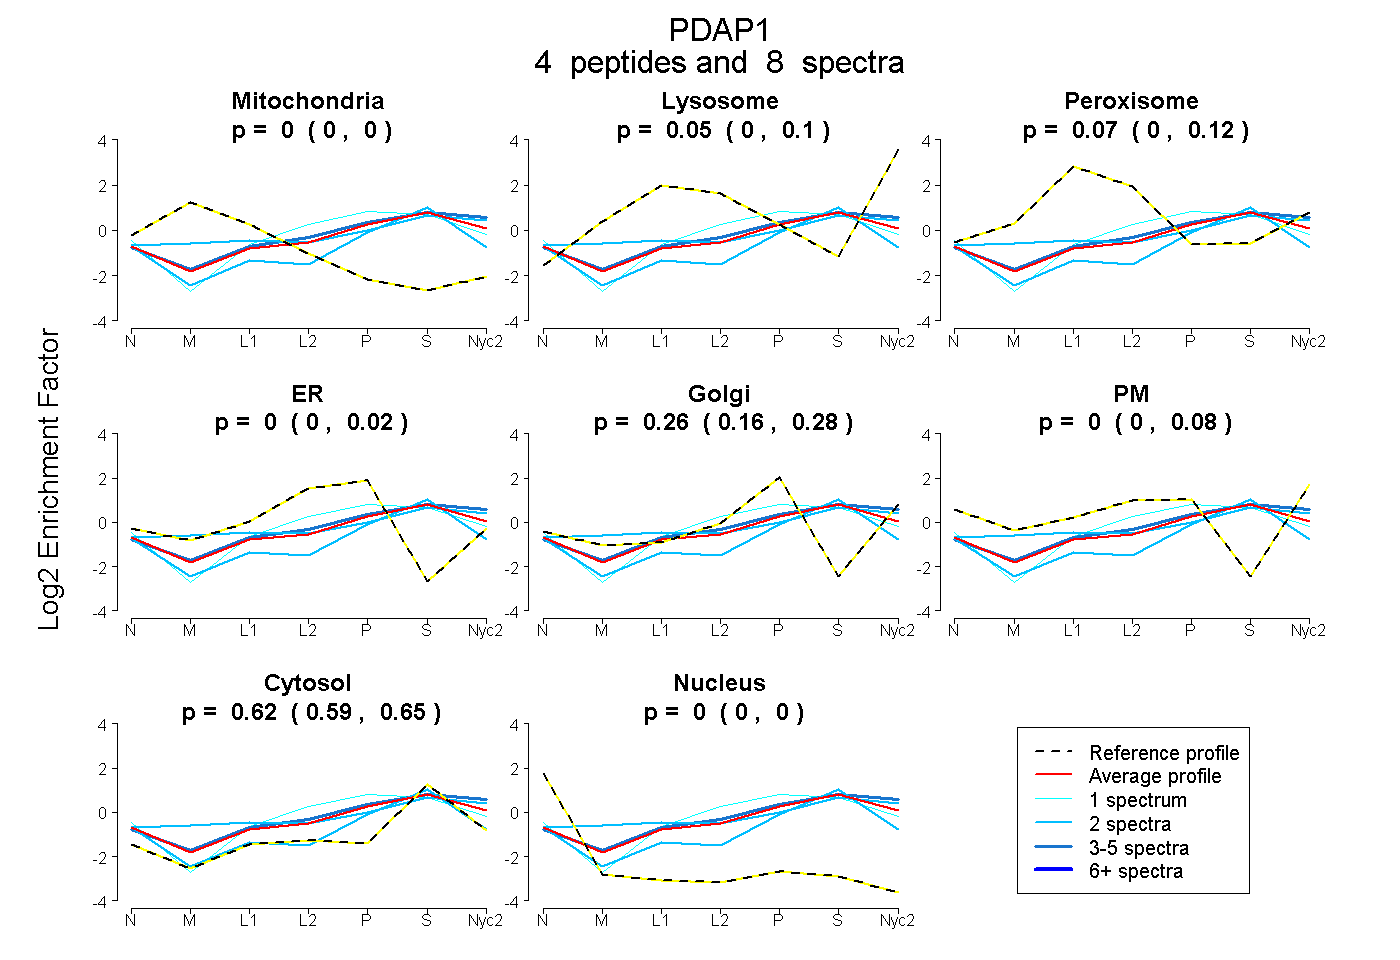
| Plot | Mito | Lyso | Perox | ER | Golgi | PM | Cytosol | Nucleus | |||||
| Expt A |
4 peptides |
8 spectra |
|
0.000 0.000 | 0.000 |
0.050 0.000 | 0.105 |
0.071 0.000 | 0.118 |
0.000 0.000 | 0.017 |
0.261 0.162 | 0.284 |
0.000 0.000 | 0.076 |
0.618 0.586 | 0.651 |
0.000 0.000 | 0.000 |
||
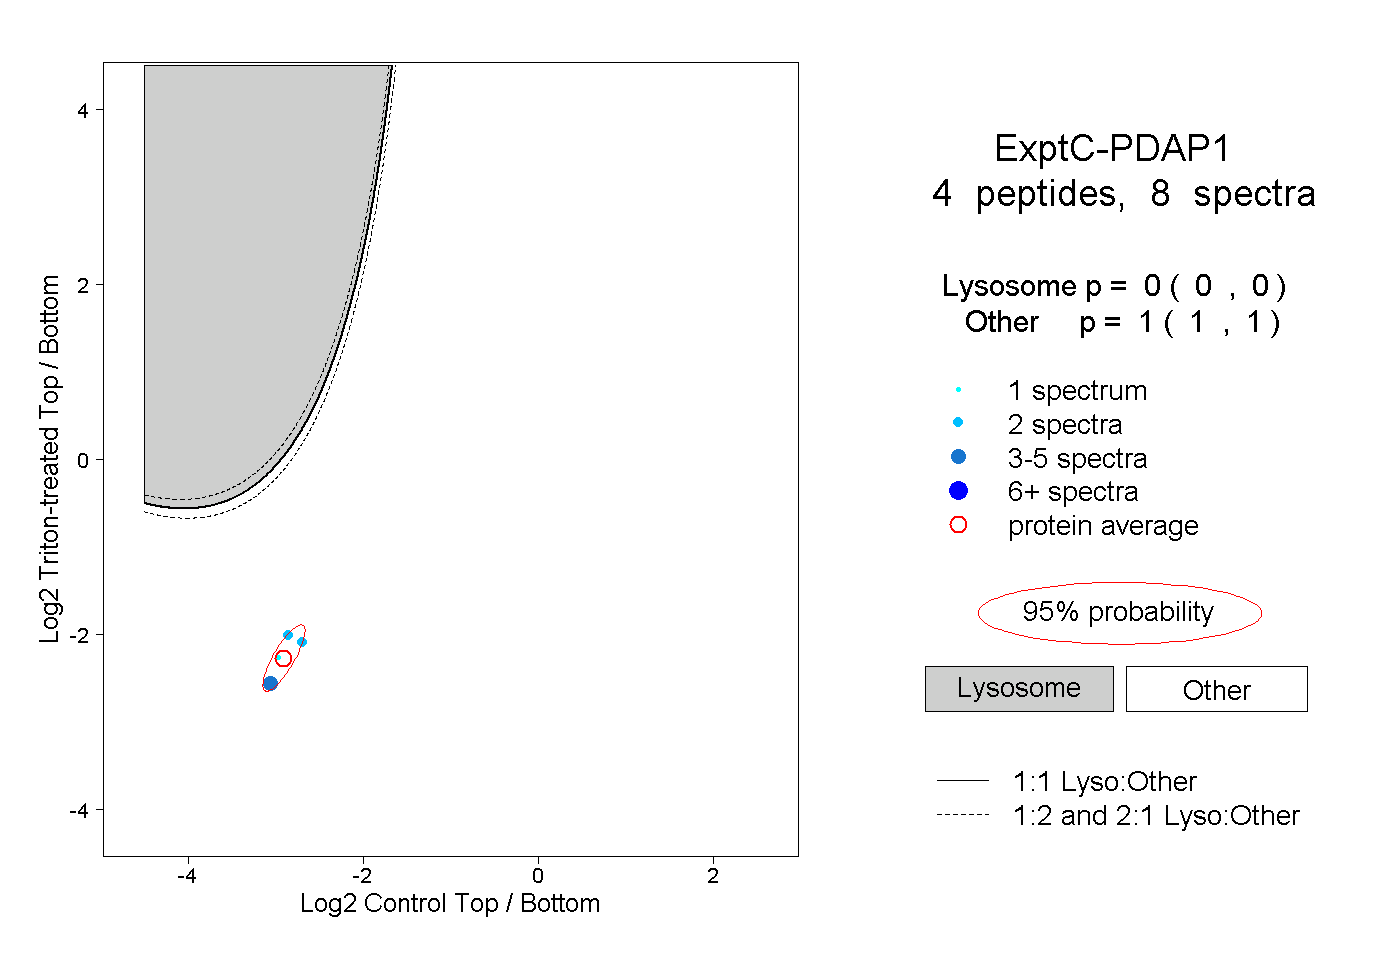
| Plot | Lyso | Other | |||||||||||
| Expt C |
4 peptides |
8 spectra |
|
0.000 0.000 | 0.000 |
1.000 1.000 | 1.000 |