 4
4peptides
spectra
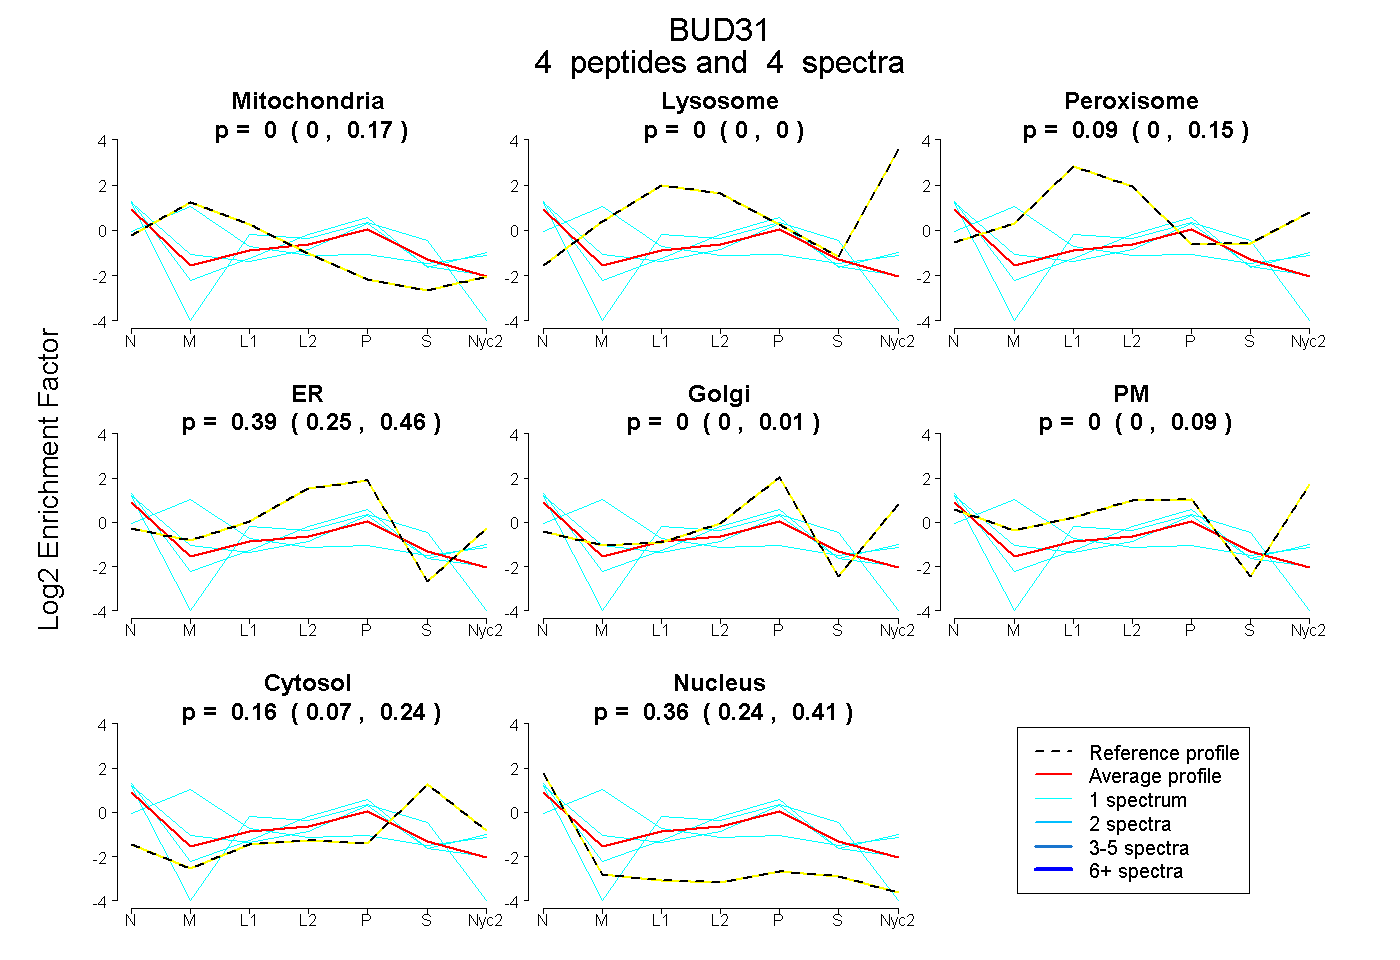
0.000 | 0.168
0.000 | 0.000
0.000 | 0.155
0.248 | 0.463
0.000 | 0.005
0.000 | 0.087
0.070 | 0.241
0.237 | 0.407
| Plot | Mito | Lyso | Perox | ER | Golgi | PM | Cytosol | Nucleus | |||||
| Expt A |
4 peptides |
4 spectra |
|
0.000 0.000 | 0.168 |
0.000 0.000 | 0.000 |
0.087 0.000 | 0.155 |
0.394 0.248 | 0.463 |
0.000 0.000 | 0.005 |
0.000 0.000 | 0.087 |
0.157 0.070 | 0.241 |
0.362 0.237 | 0.407 |
| 1 spectrum, EAETEPHEGK | 0.000 | 0.000 | 0.000 | 0.357 | 0.064 | 0.160 | 0.118 | 0.302 | ||
| 1 spectrum, DTNFGTNCICR | 0.040 | 0.000 | 0.000 | 0.446 | 0.031 | 0.013 | 0.088 | 0.381 | ||
| 1 spectrum, ELYEYCIK | 0.000 | 0.000 | 0.000 | 0.323 | 0.000 | 0.000 | 0.289 | 0.389 | ||
| 1 spectrum, IIECTHCGCR | 0.658 | 0.000 | 0.000 | 0.000 | 0.173 | 0.019 | 0.150 | 0.000 |
| Plot | Lyso | Other | |||||||||||
| Expt C |
1 peptide |
1 spectrum |
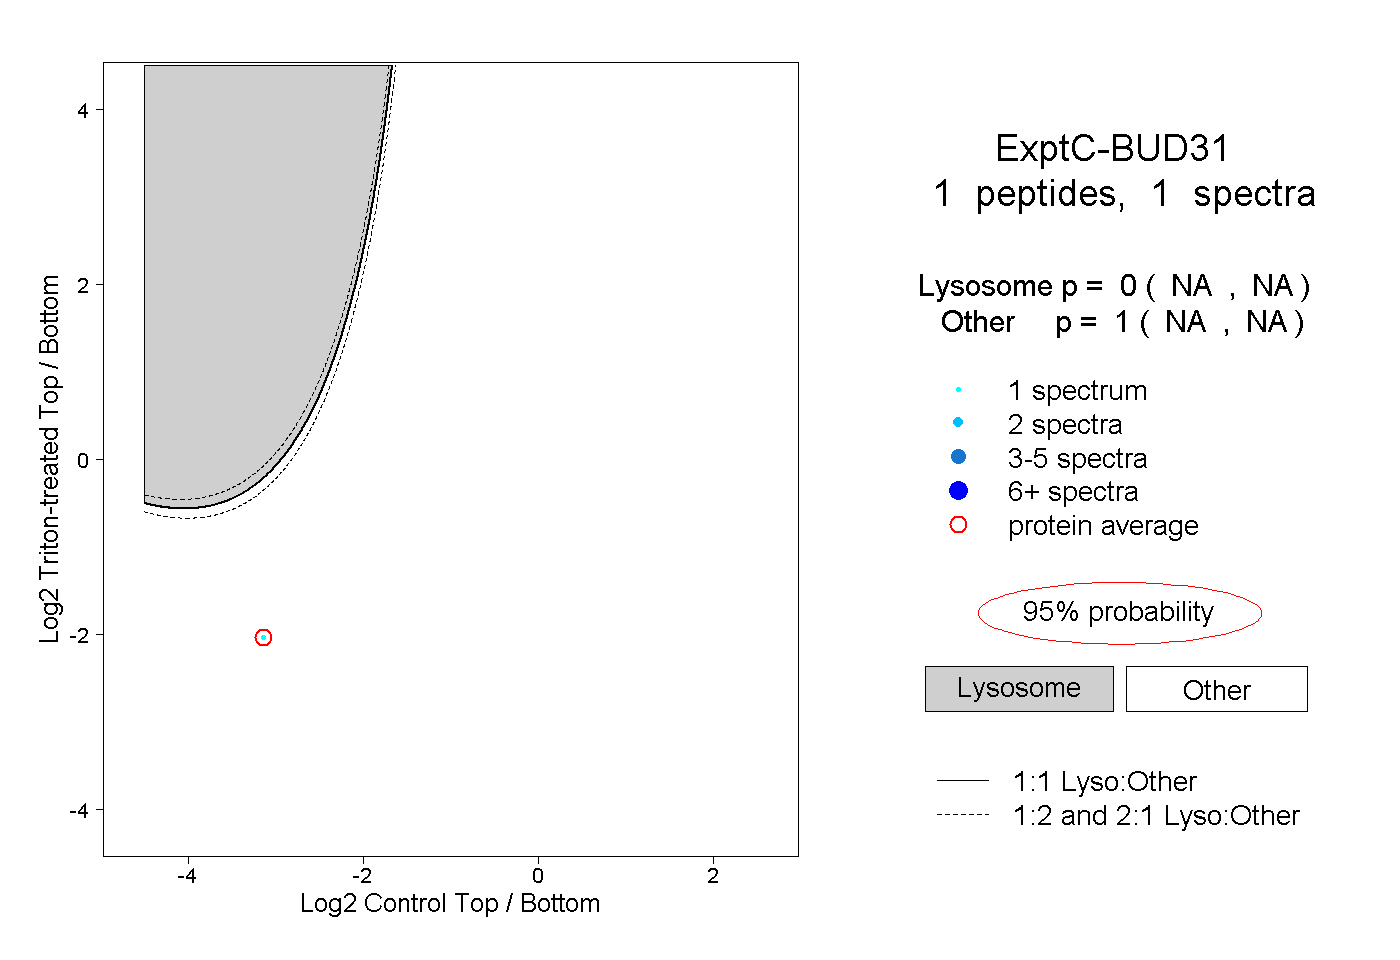 |
0.000 NA | NA |
1.000 NA | NA |