 4
4peptides
spectra
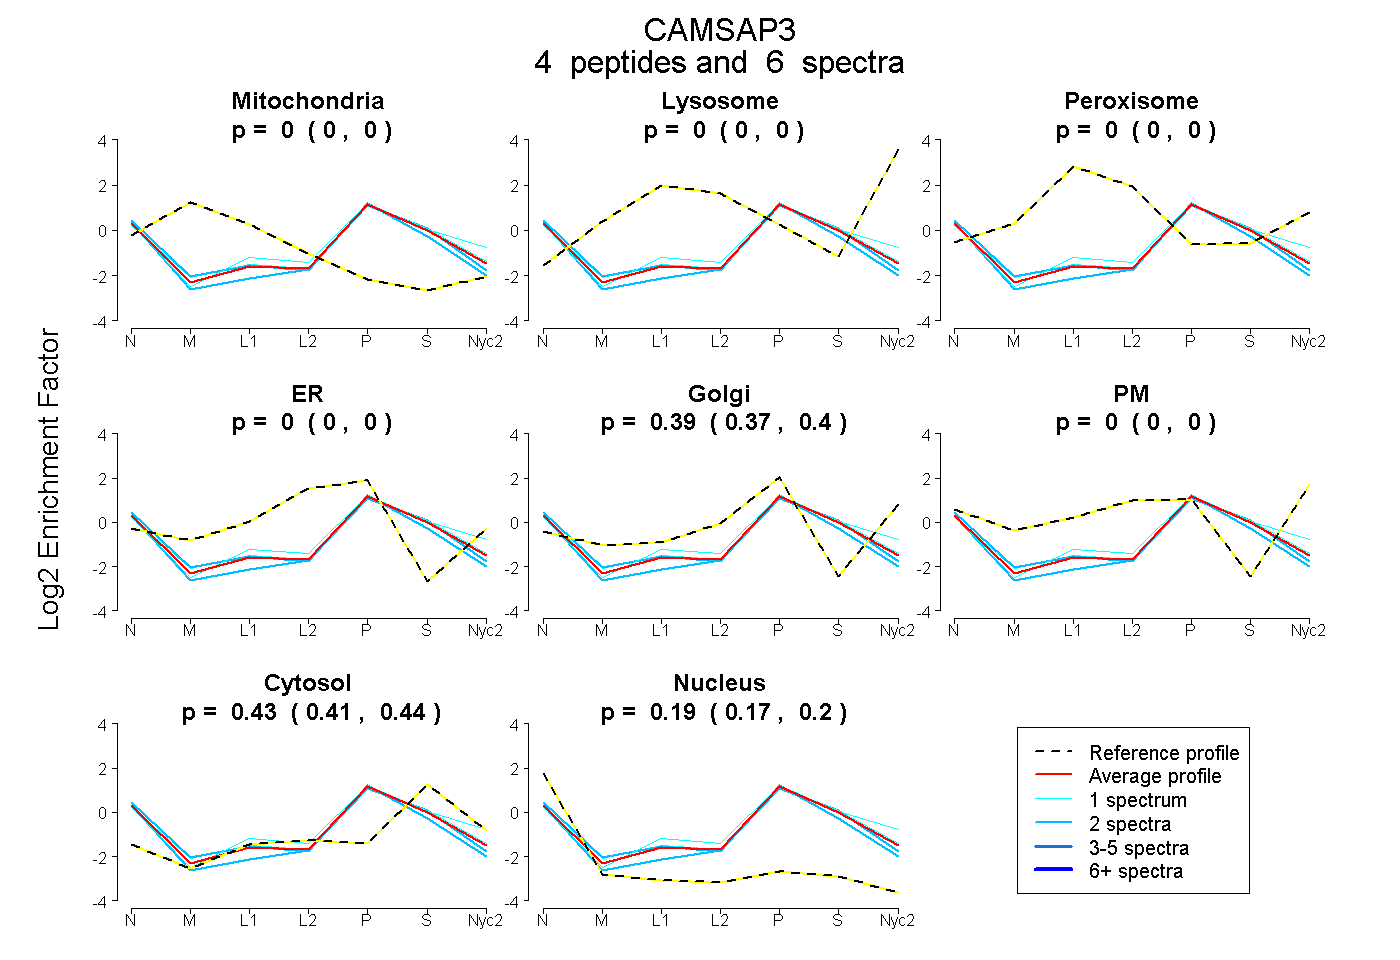
0.000 | 0.000
0.000 | 0.000
0.000 | 0.000
0.000 | 0.000
0.368 | 0.401
0.000 | 0.000
0.413 | 0.440
0.167 | 0.202
| Plot | Mito | Lyso | Perox | ER | Golgi | PM | Cytosol | Nucleus | |||||
| Expt A |
4 peptides |
6 spectra |
|
0.000 0.000 | 0.000 |
0.000 0.000 | 0.000 |
0.000 0.000 | 0.000 |
0.000 0.000 | 0.000 |
0.386 0.368 | 0.401 |
0.000 0.000 | 0.000 |
0.428 0.413 | 0.440 |
0.186 0.167 | 0.202 |
| 1 spectrum, FSPSQVPVQTR | 0.000 | 0.000 | 0.000 | 0.000 | 0.389 | 0.000 | 0.452 | 0.159 | ||
| 1 spectrum, LSAALSSLQR | 0.000 | 0.000 | 0.000 | 0.000 | 0.445 | 0.000 | 0.460 | 0.095 | ||
| 2 spectra, AASPSPAR | 0.000 | 0.000 | 0.000 | 0.000 | 0.320 | 0.000 | 0.448 | 0.232 | ||
| 2 spectra, LMDDIDK | 0.000 | 0.000 | 0.000 | 0.024 | 0.371 | 0.000 | 0.354 | 0.251 |
| Plot | Lyso | Other | |||||||||||
| Expt C |
2 peptides |
6 spectra |
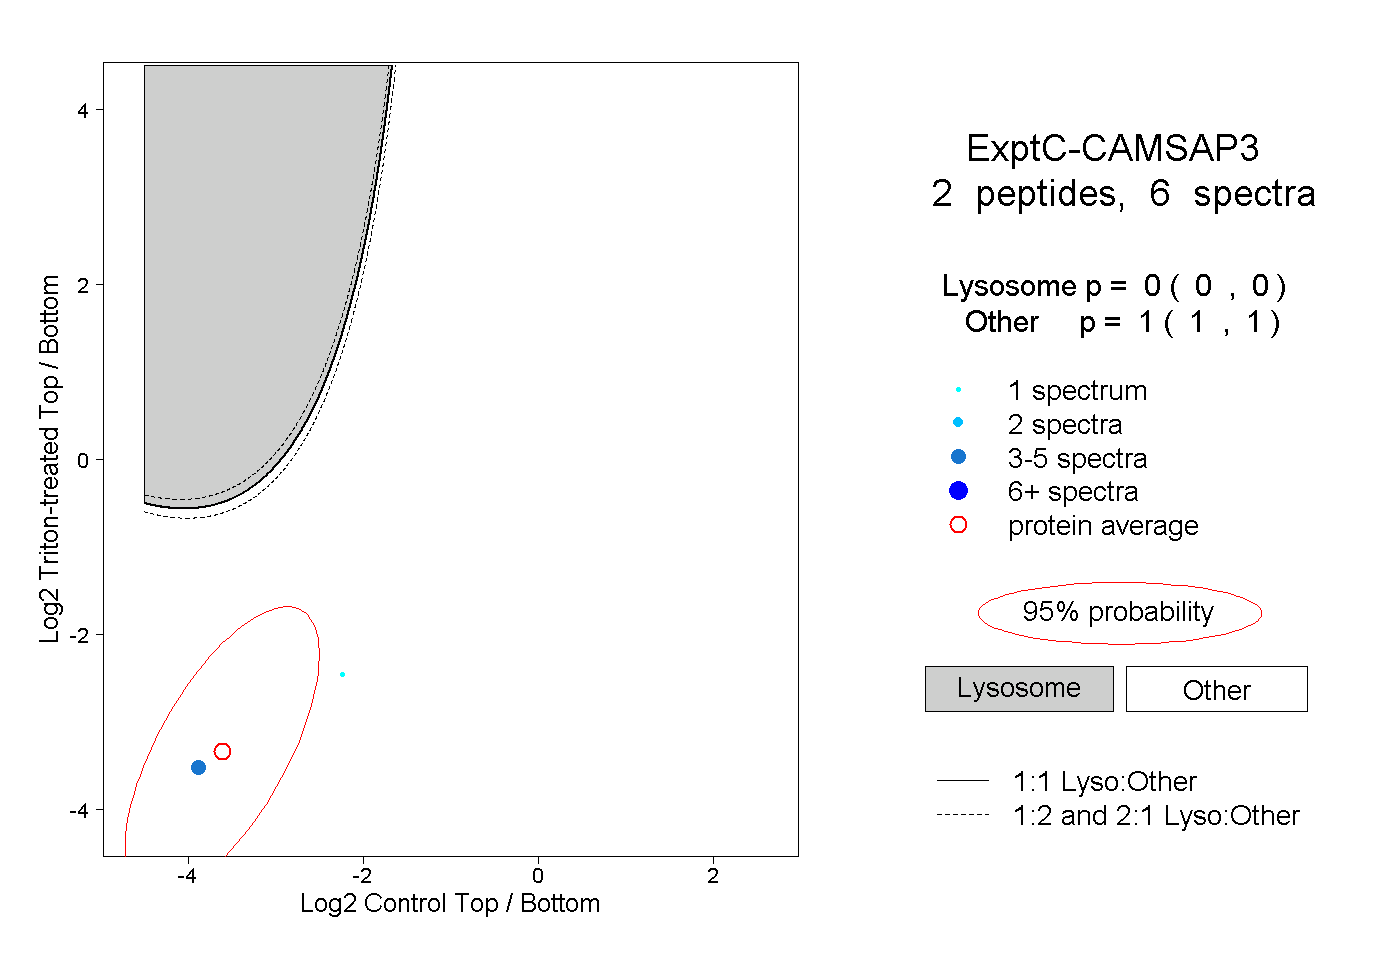 |
0.000 0.000 | 0.000 |
1.000 1.000 | 1.000 |