 6
6peptides
spectra
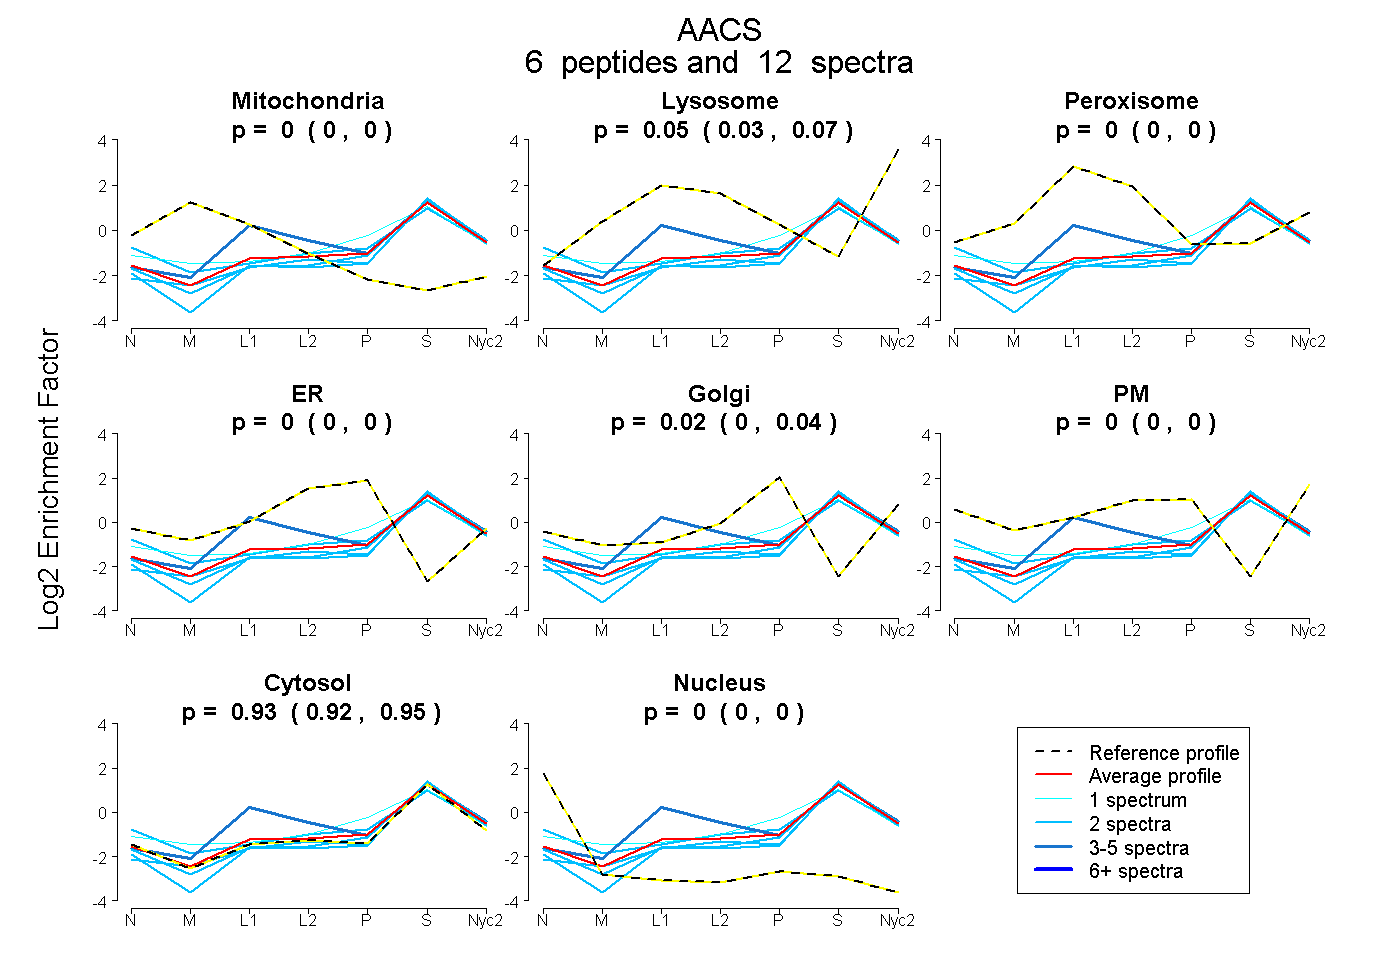
0.000 | 0.000
0.027 | 0.071
0.000 | 0.000
0.000 | 0.000
0.000 | 0.037
0.000 | 0.000
0.917 | 0.945
0.000 | 0.000
2peptides
spectra
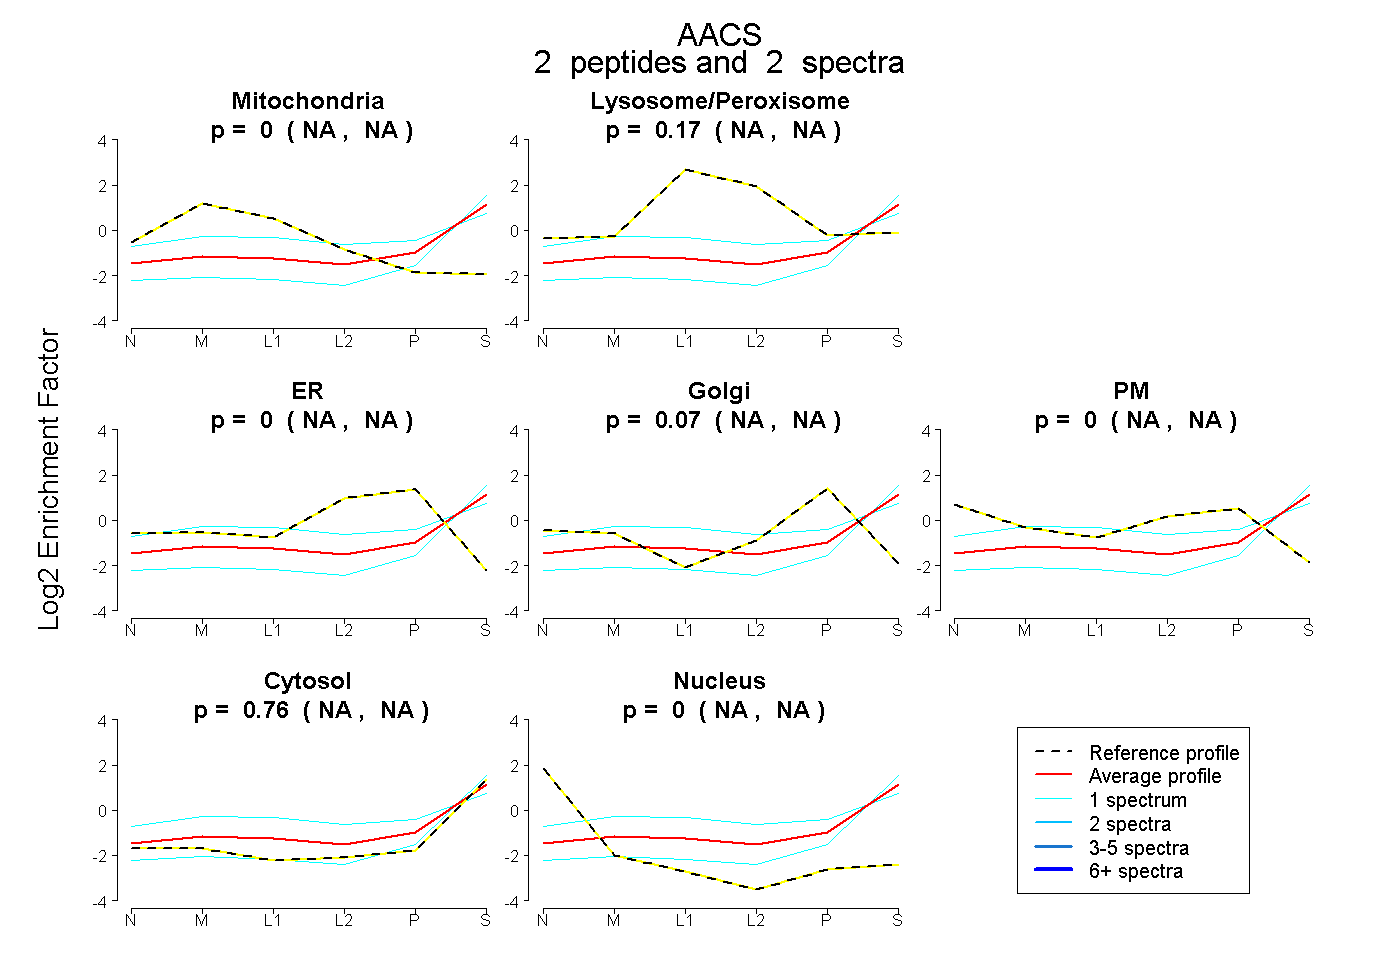
NA | NA
NA | NA
NA | NA
NA | NA
NA | NA
NA | NA
NA | NA
4peptides
spectra
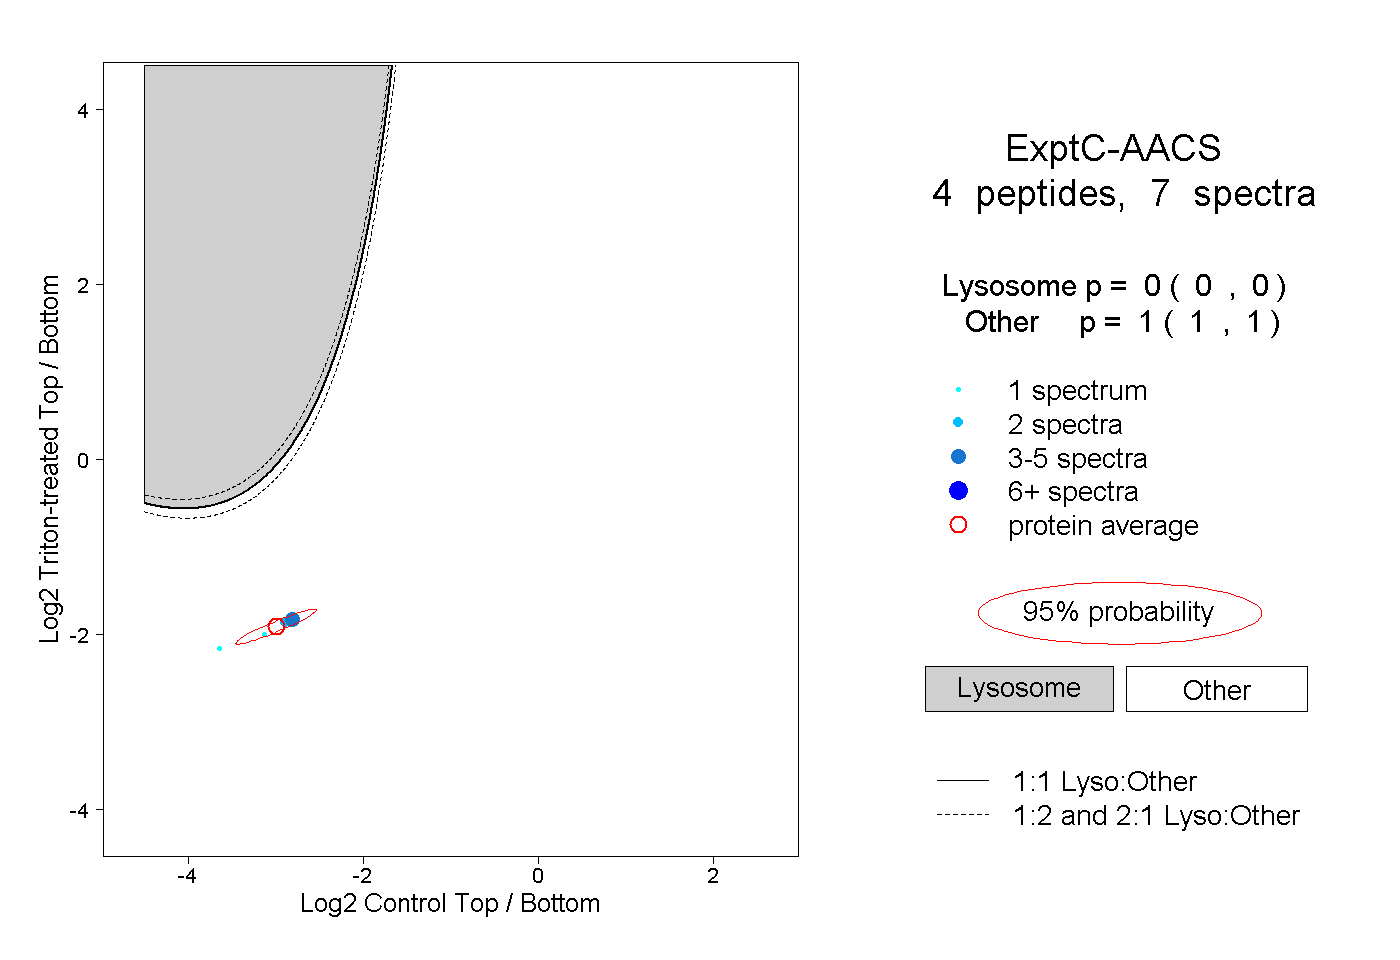
0.000 | 0.000
1.000 | 1.000