 6
6peptides
spectra
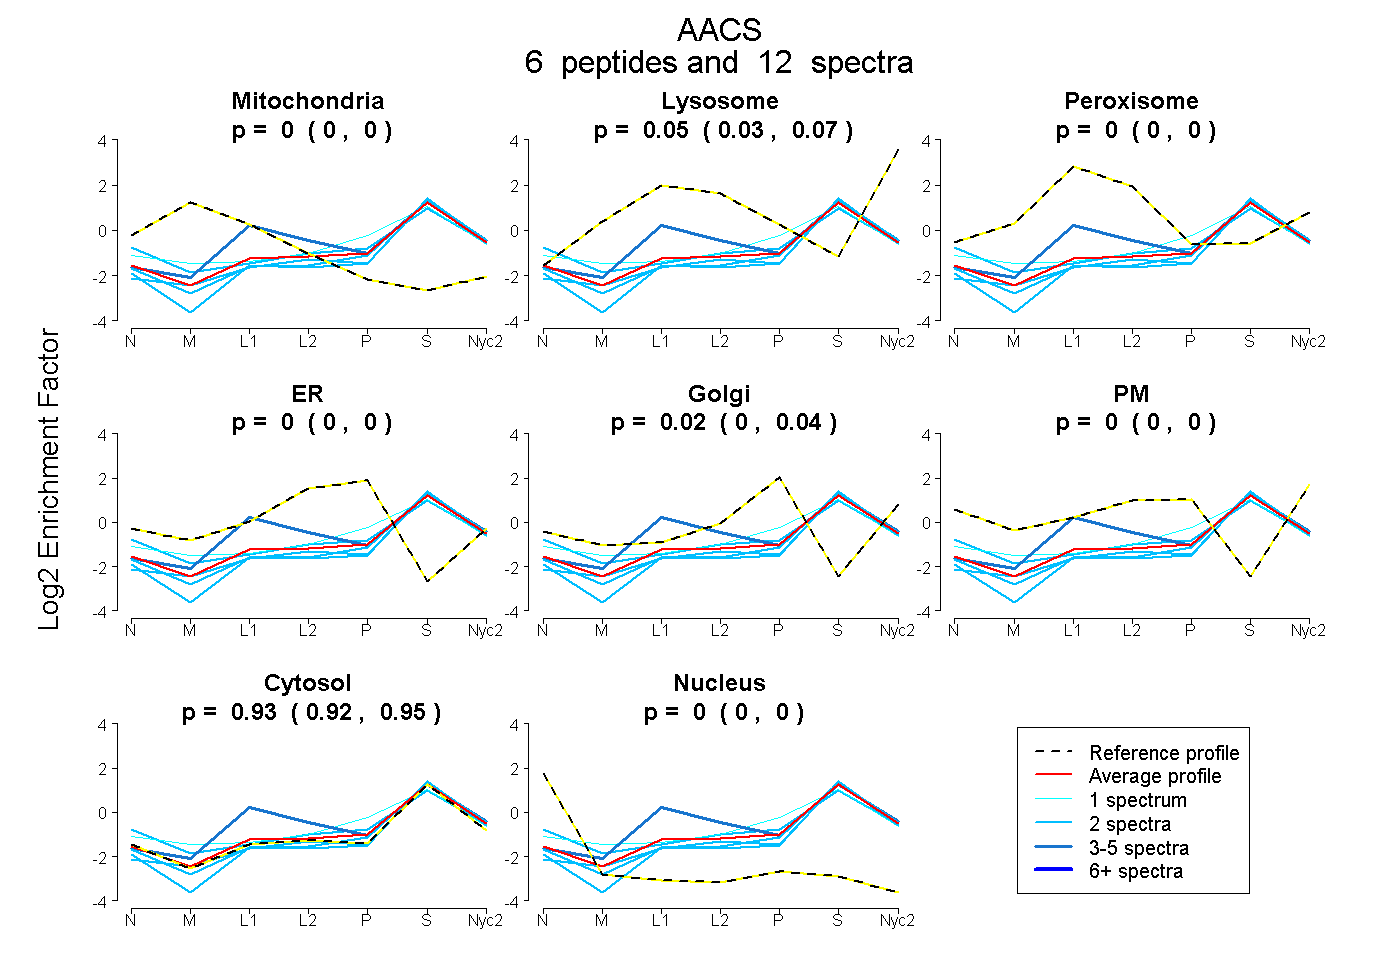
0.000 | 0.000
0.027 | 0.071
0.000 | 0.000
0.000 | 0.000
0.000 | 0.037
0.000 | 0.000
0.917 | 0.945
0.000 | 0.000
2peptides
spectra
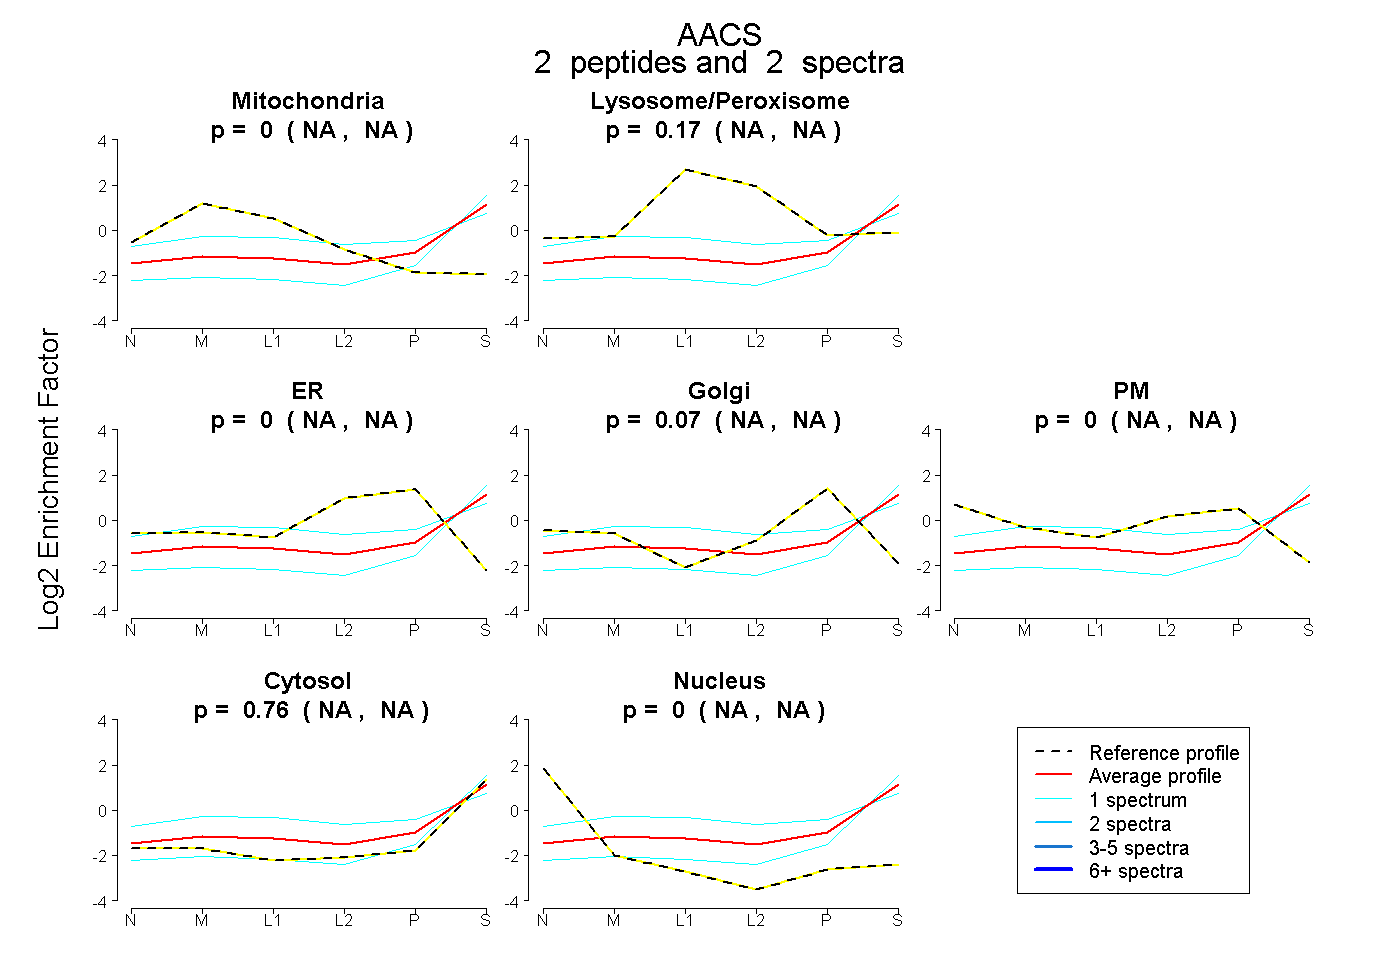
NA | NA
NA | NA
NA | NA
NA | NA
NA | NA
NA | NA
NA | NA
| Plot | Mito | Lyso | Perox | ER | Golgi | PM | Cytosol | Nucleus | |||||
| Expt A |
6 peptides |
12 spectra |
|
0.000 0.000 | 0.000 |
0.052 0.027 | 0.071 |
0.000 0.000 | 0.000 |
0.000 0.000 | 0.000 |
0.015 0.000 | 0.037 |
0.000 0.000 | 0.000 |
0.933 0.917 | 0.945 |
0.000 0.000 | 0.000 |
||
| Plot | Mito | Lyso or Perox | ER | Golgi | PM | Cytosol | Nucleus | ||||||
| Expt B |
2 peptides |
2 spectra |
|
0.000 NA | NA |
0.169 NA | NA |
0.000 NA | NA |
0.071 NA | NA |
0.000 NA | NA |
0.759 NA | NA |
0.000 NA | NA |
| 1 spectrum, WLSVLEEK | 0.000 | 0.000 | 0.000 | 0.000 | 0.000 | 1.000 | 0.000 | |||
| 1 spectrum, GAFSNPESLDLYR | 0.043 | 0.358 | 0.000 | 0.149 | 0.000 | 0.451 | 0.000 |
| Plot | Lyso | Other | |||||||||||
| Expt C |
4 peptides |
7 spectra |
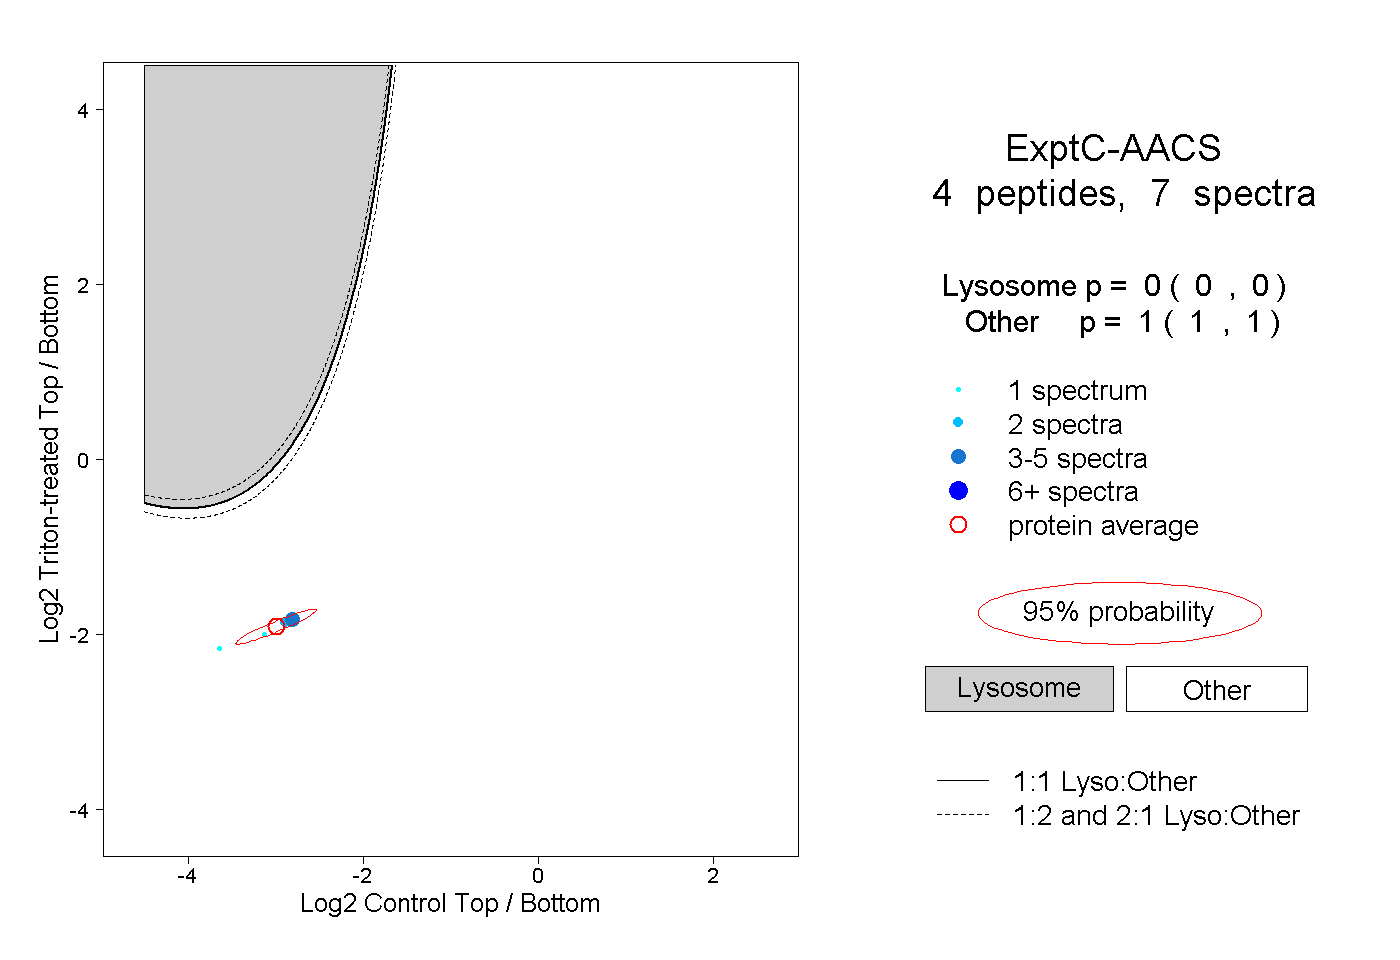 |
0.000 0.000 | 0.000 |
1.000 1.000 | 1.000 |