20
20peptides
spectra
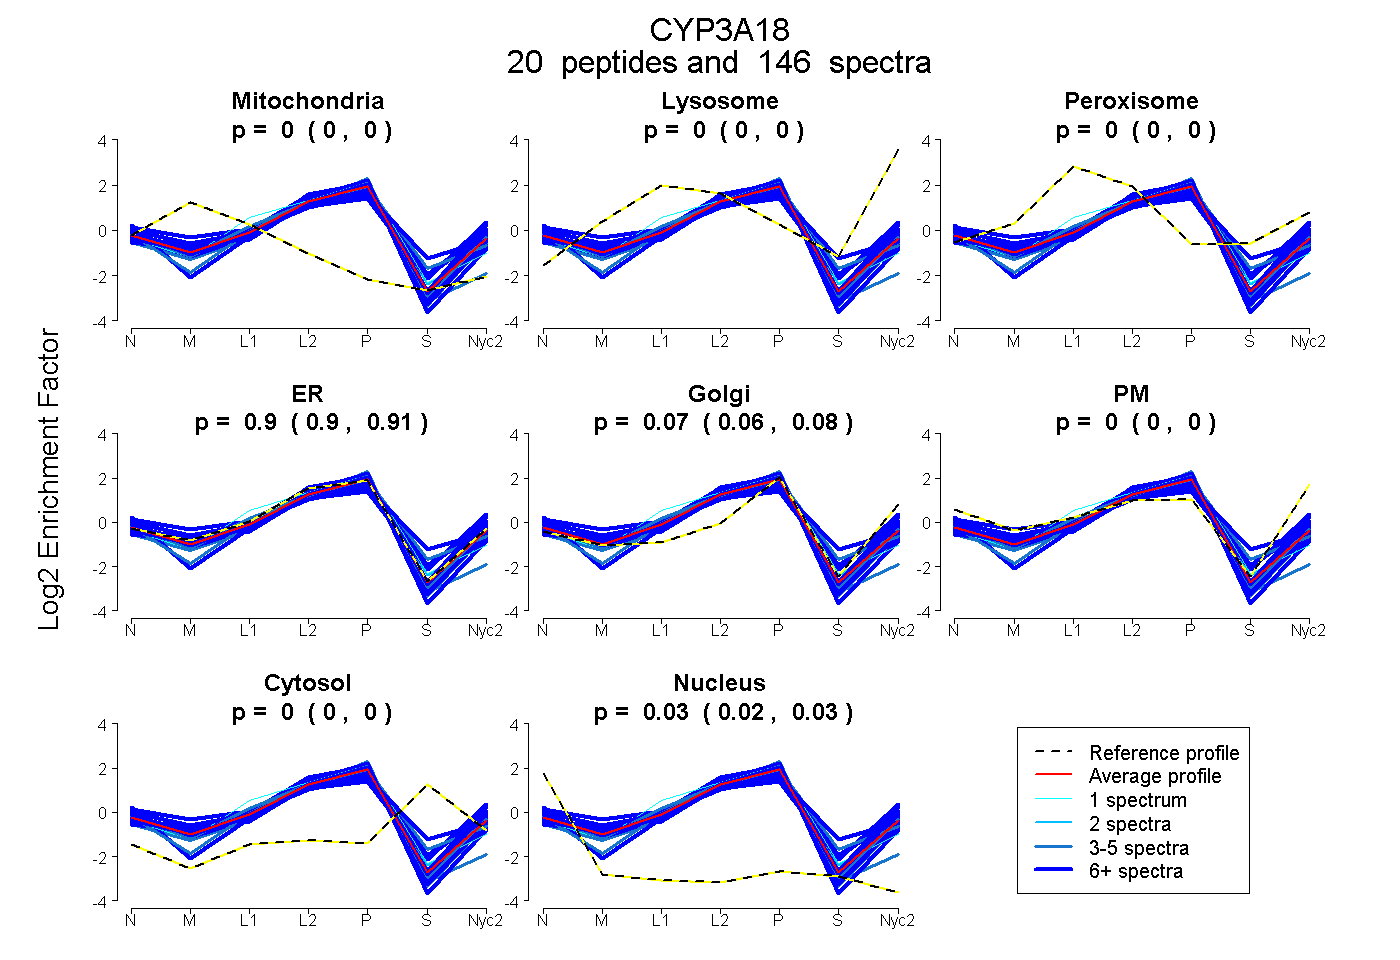
0.000 | 0.000
0.000 | 0.000
0.000 | 0.000
0.897 | 0.907
0.065 | 0.077
0.000 | 0.000
0.000 | 0.000
0.025 | 0.028
15peptides
spectra
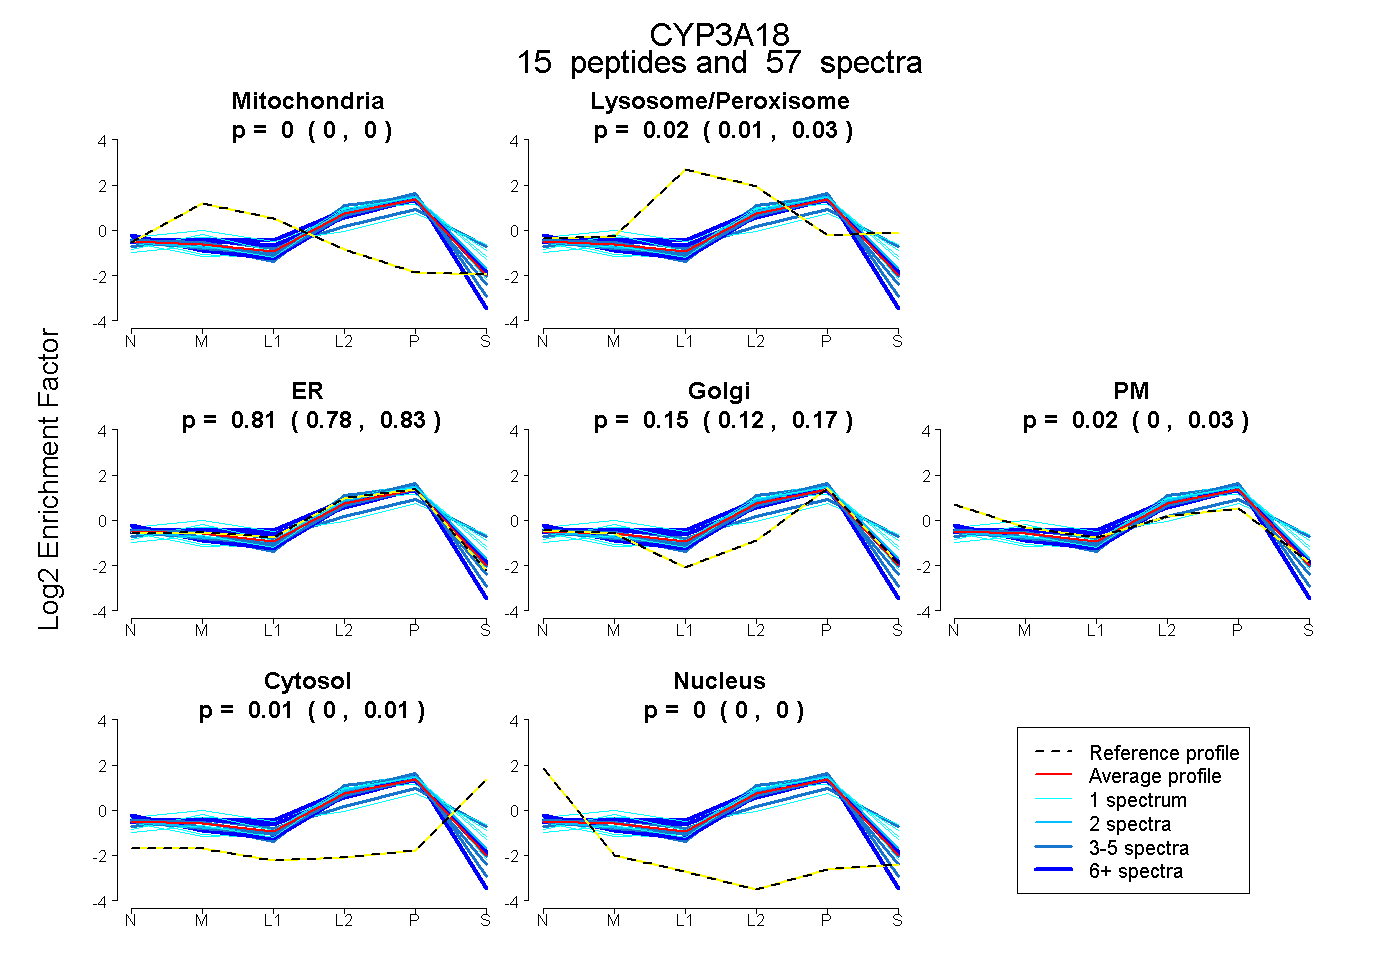
0.000 | 0.000
0.006 | 0.033
0.780 | 0.827
0.124 | 0.171
0.002 | 0.030
0.000 | 0.013
0.000 | 0.000
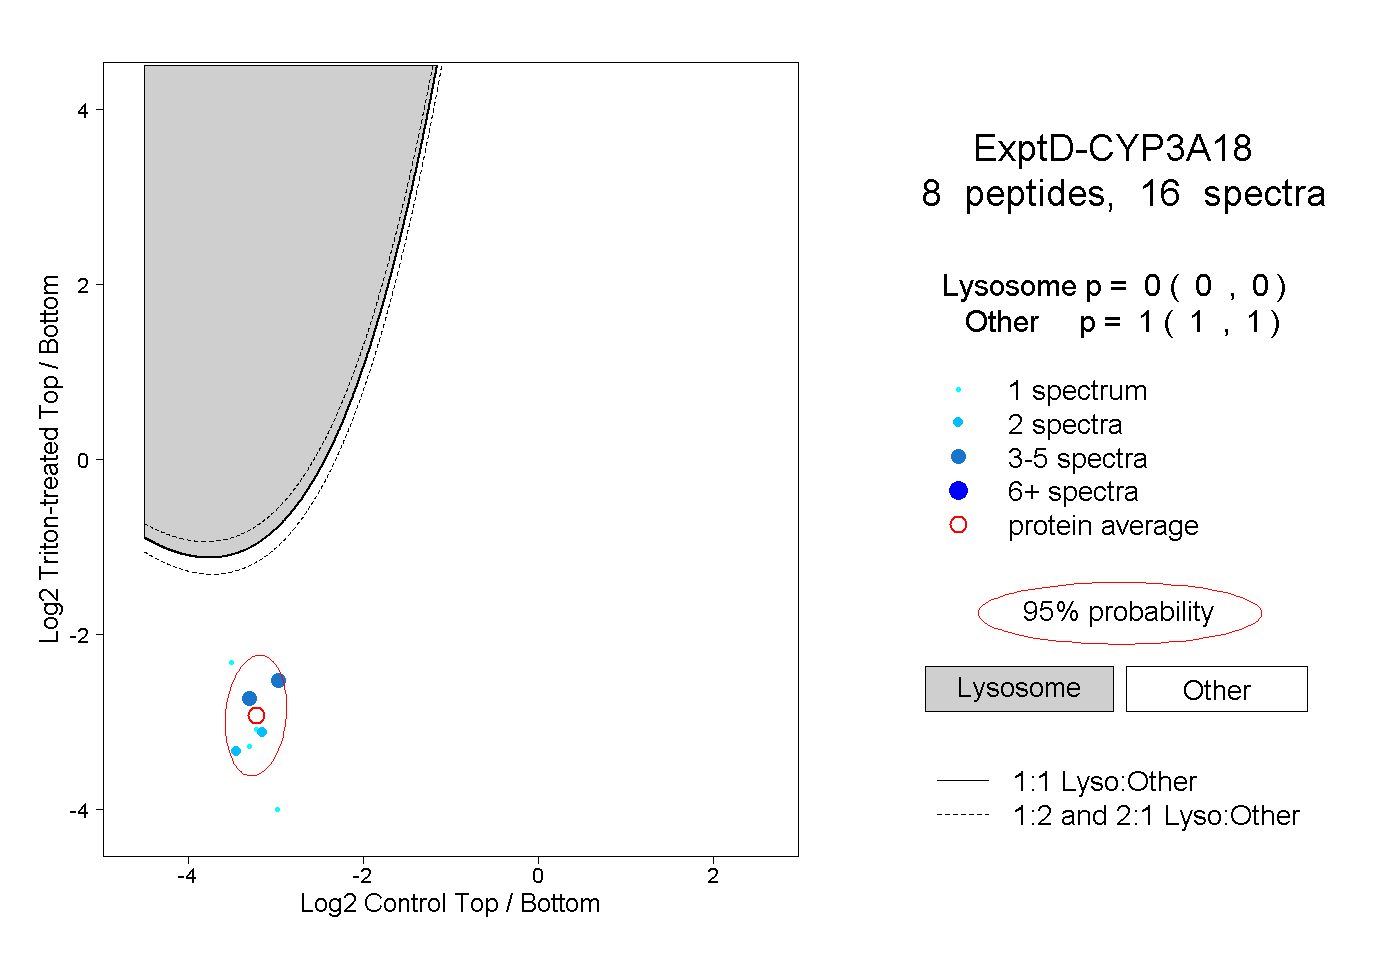
19peptides
spectra
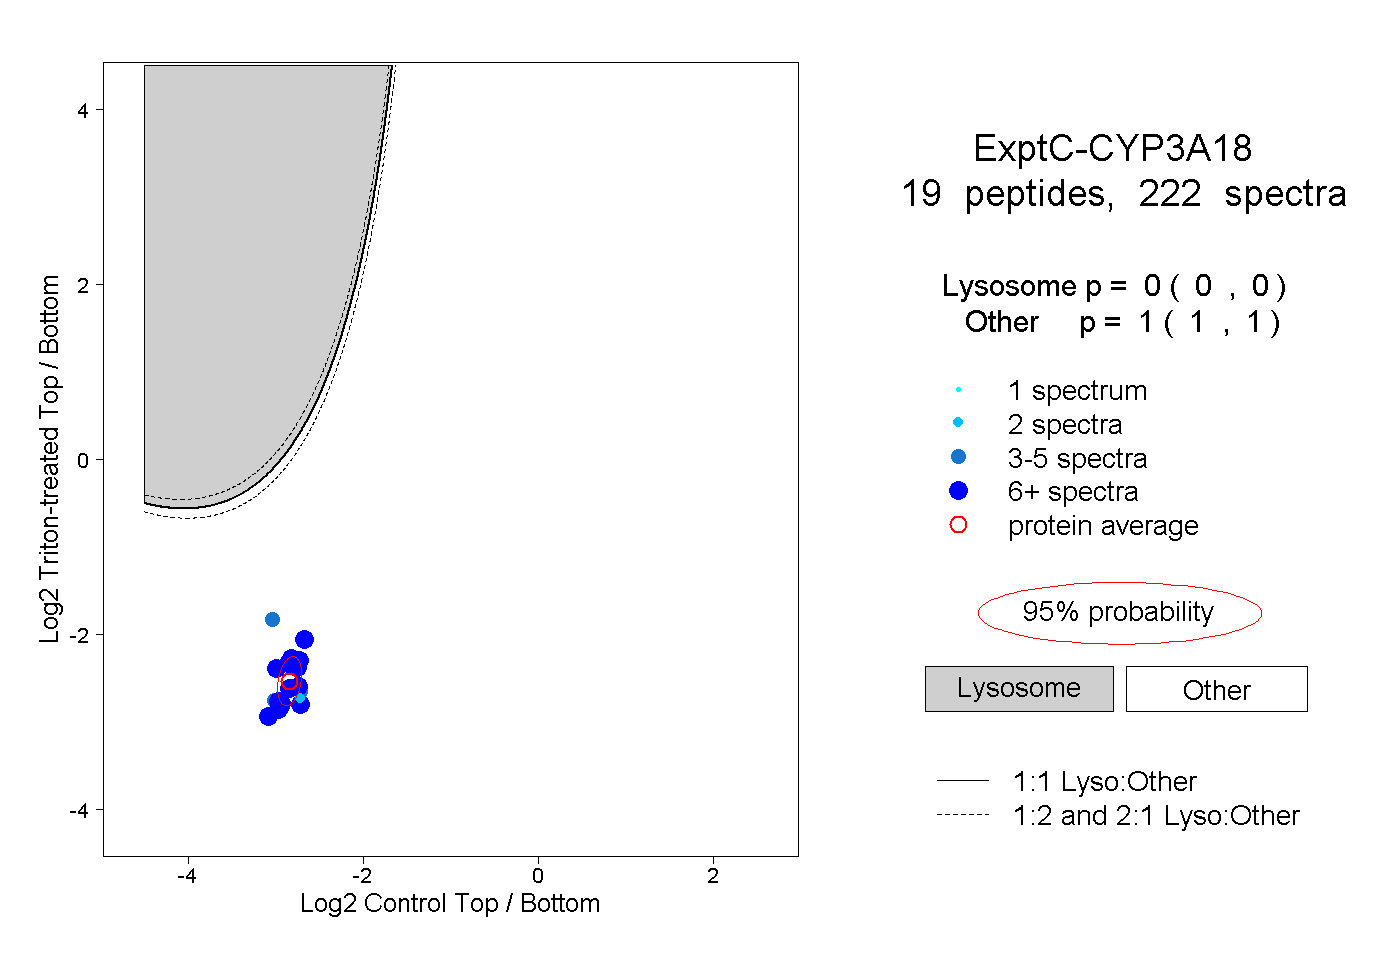
0.000 | 0.000
1.000 | 1.000