 20
20peptides
spectra
0.000 | 0.000
0.000 | 0.000
0.000 | 0.000
0.897 | 0.907
0.065 | 0.077
0.000 | 0.000
0.000 | 0.000
0.025 | 0.028
| Plot | Mito | Lyso | Perox | ER | Golgi | PM | Cytosol | Nucleus | |||||
| Expt A |
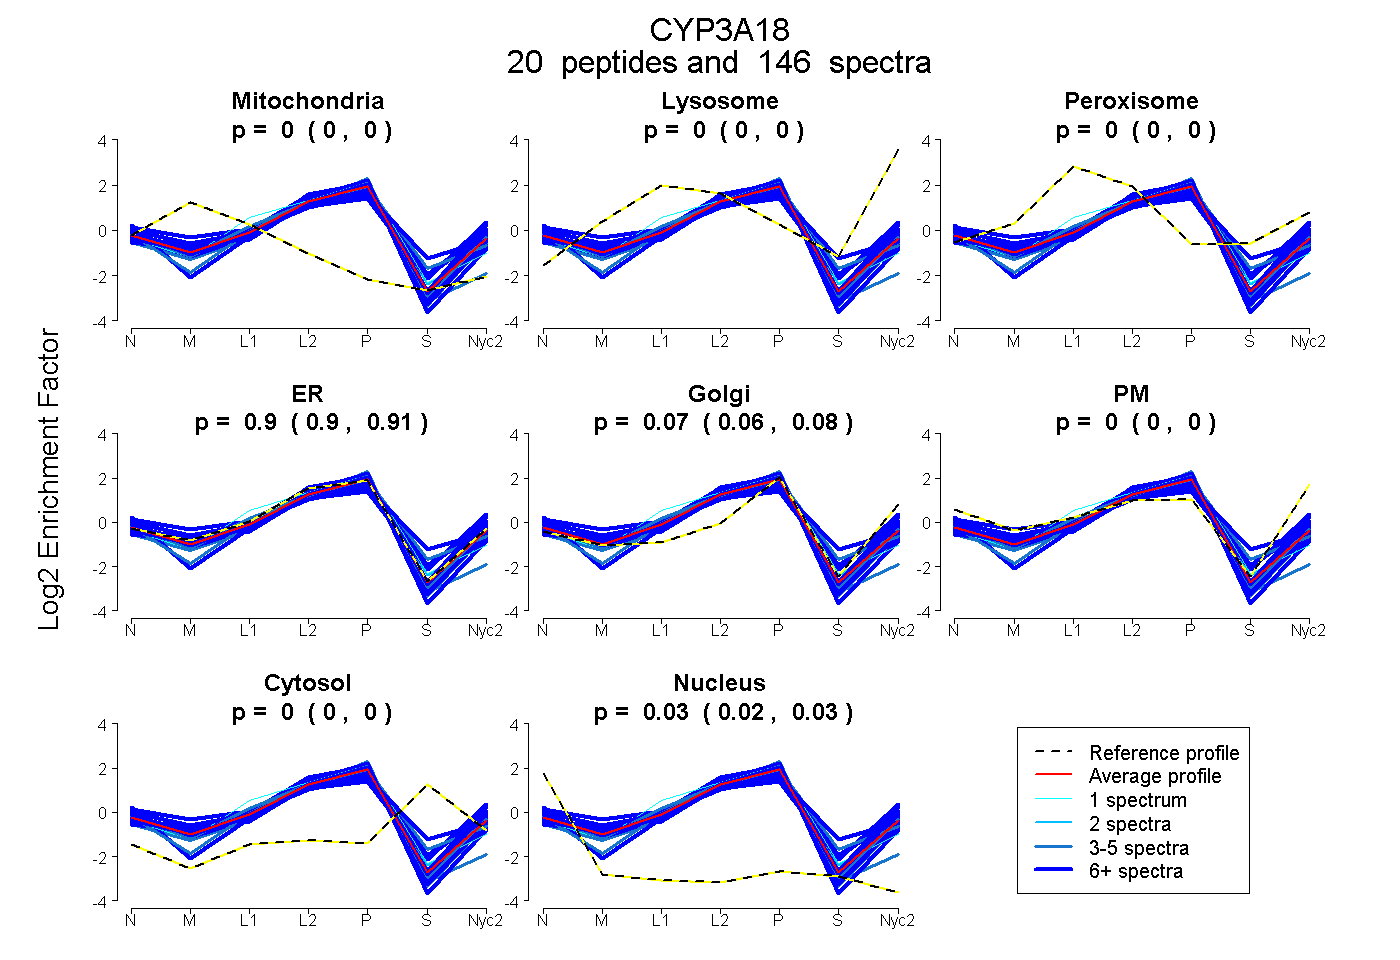
20 peptides |
146 spectra |
|
0.000 0.000 | 0.000 |
0.000 0.000 | 0.000 |
0.000 0.000 | 0.000 |
0.902 0.897 | 0.907 |
0.071 0.065 | 0.077 |
0.000 0.000 | 0.000 |
0.000 0.000 | 0.000 |
0.027 0.025 | 0.028 |
| 7 spectra, TLLSPTFTSGK | 0.000 | 0.000 | 0.045 | 0.753 | 0.000 | 0.000 | 0.202 | 0.000 | ||
| 8 spectra, LYPIATR | 0.000 | 0.000 | 0.000 | 0.948 | 0.000 | 0.000 | 0.000 | 0.052 | ||
| 8 spectra, EMFPLMR | 0.000 | 0.000 | 0.000 | 0.905 | 0.095 | 0.000 | 0.000 | 0.000 | ||
| 5 spectra, QYGDTLLK | 0.000 | 0.000 | 0.000 | 0.930 | 0.053 | 0.000 | 0.000 | 0.016 | ||
| 7 spectra, VDFLQLMMNTQNSK | 0.000 | 0.000 | 0.000 | 0.758 | 0.242 | 0.000 | 0.000 | 0.000 | ||
| 21 spectra, NCIGMR | 0.000 | 0.000 | 0.000 | 0.983 | 0.000 | 0.000 | 0.000 | 0.017 | ||
| 3 spectra, QPIFQPEGPIILK | 0.000 | 0.000 | 0.000 | 0.840 | 0.000 | 0.000 | 0.160 | 0.000 | ||
| 8 spectra, QSMNFFK | 0.023 | 0.000 | 0.000 | 0.610 | 0.138 | 0.228 | 0.000 | 0.001 | ||
| 4 spectra, ECYSVFTNR | 0.029 | 0.000 | 0.000 | 0.885 | 0.000 | 0.000 | 0.000 | 0.085 | ||
| 4 spectra, AITMSEDEEWK | 0.000 | 0.000 | 0.000 | 0.865 | 0.130 | 0.005 | 0.000 | 0.000 | ||
| 8 spectra, CFGPMGFMK | 0.002 | 0.000 | 0.000 | 0.993 | 0.005 | 0.000 | 0.000 | 0.000 | ||
| 2 spectra, DVEINGVFIPK | 0.000 | 0.000 | 0.000 | 0.924 | 0.000 | 0.000 | 0.022 | 0.055 | ||
| 20 spectra, GEPINMK | 0.000 | 0.000 | 0.072 | 0.669 | 0.192 | 0.000 | 0.067 | 0.000 | ||
| 3 spectra, GQESQK | 0.000 | 0.000 | 0.000 | 0.969 | 0.000 | 0.000 | 0.000 | 0.031 | ||
| 14 spectra, FALISMK | 0.000 | 0.000 | 0.000 | 0.871 | 0.080 | 0.048 | 0.000 | 0.001 | ||
| 3 spectra, GSIDPYVYLPFGNGPR | 0.000 | 0.000 | 0.000 | 0.837 | 0.134 | 0.000 | 0.000 | 0.029 | ||
| 8 spectra, LQNEIDR | 0.000 | 0.001 | 0.000 | 0.730 | 0.156 | 0.038 | 0.075 | 0.000 | ||
| 6 spectra, LDSNQK | 0.000 | 0.000 | 0.000 | 0.937 | 0.000 | 0.000 | 0.000 | 0.063 | ||
| 6 spectra, GTVVTIPIYPLHR | 0.049 | 0.000 | 0.047 | 0.465 | 0.072 | 0.344 | 0.022 | 0.000 | ||
| 1 spectrum, NPEYWLEPEEFNPER | 0.000 | 0.000 | 0.000 | 0.960 | 0.000 | 0.000 | 0.039 | 0.002 |
| Plot | Mito | Lyso or Perox | ER | Golgi | PM | Cytosol | Nucleus | ||||||
| Expt B |
15 peptides |
57 spectra |
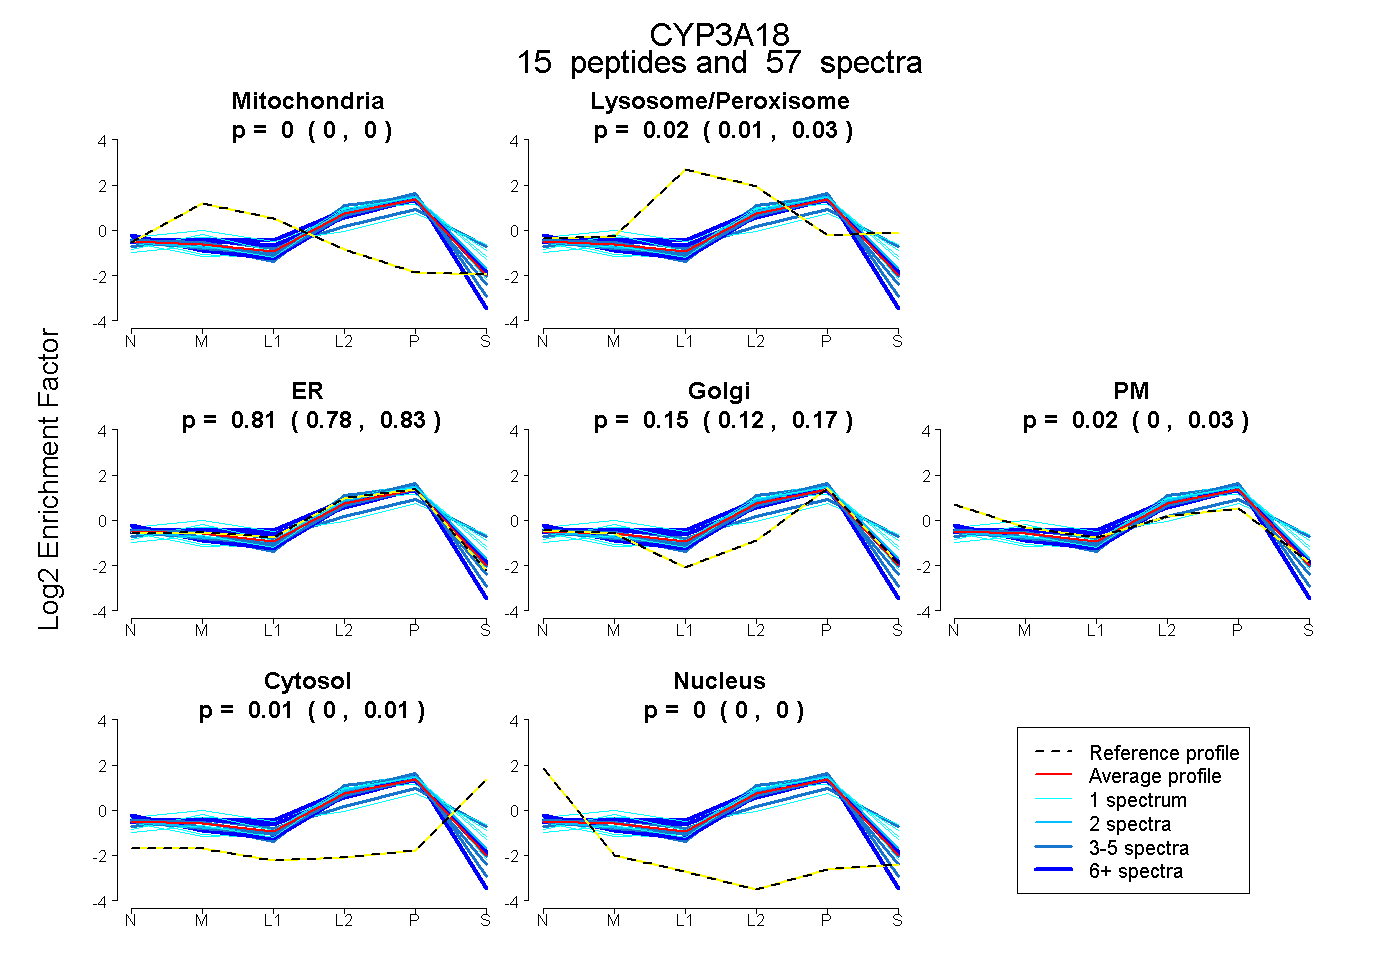 |
0.000 0.000 | 0.000 |
0.020 0.006 | 0.033 |
0.806 0.780 | 0.827 |
0.149 0.124 | 0.171 |
0.017 0.002 | 0.030 |
0.007 0.000 | 0.013 |
0.000 0.000 | 0.000 |
|||
| Plot | Lyso | Other | |||||||||||
| Expt C |
19 peptides |
222 spectra |
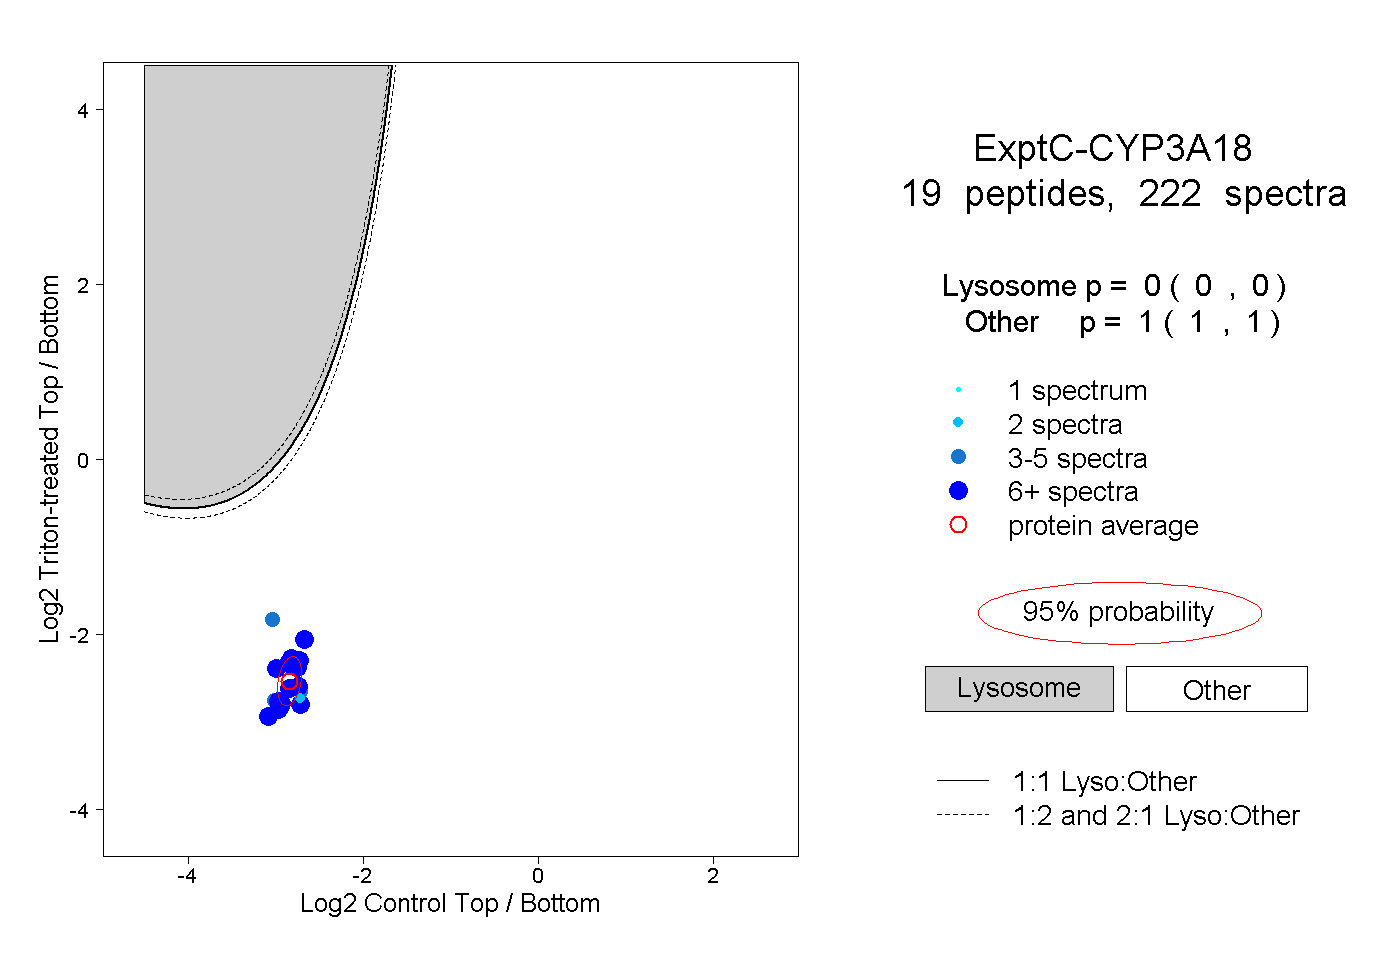 |
0.000 0.000 | 0.000 |
1.000 1.000 | 1.000 |
||||||||
| Plot | Lyso | Other | |||||||||||
| Expt D |
8 peptides |
16 spectra |
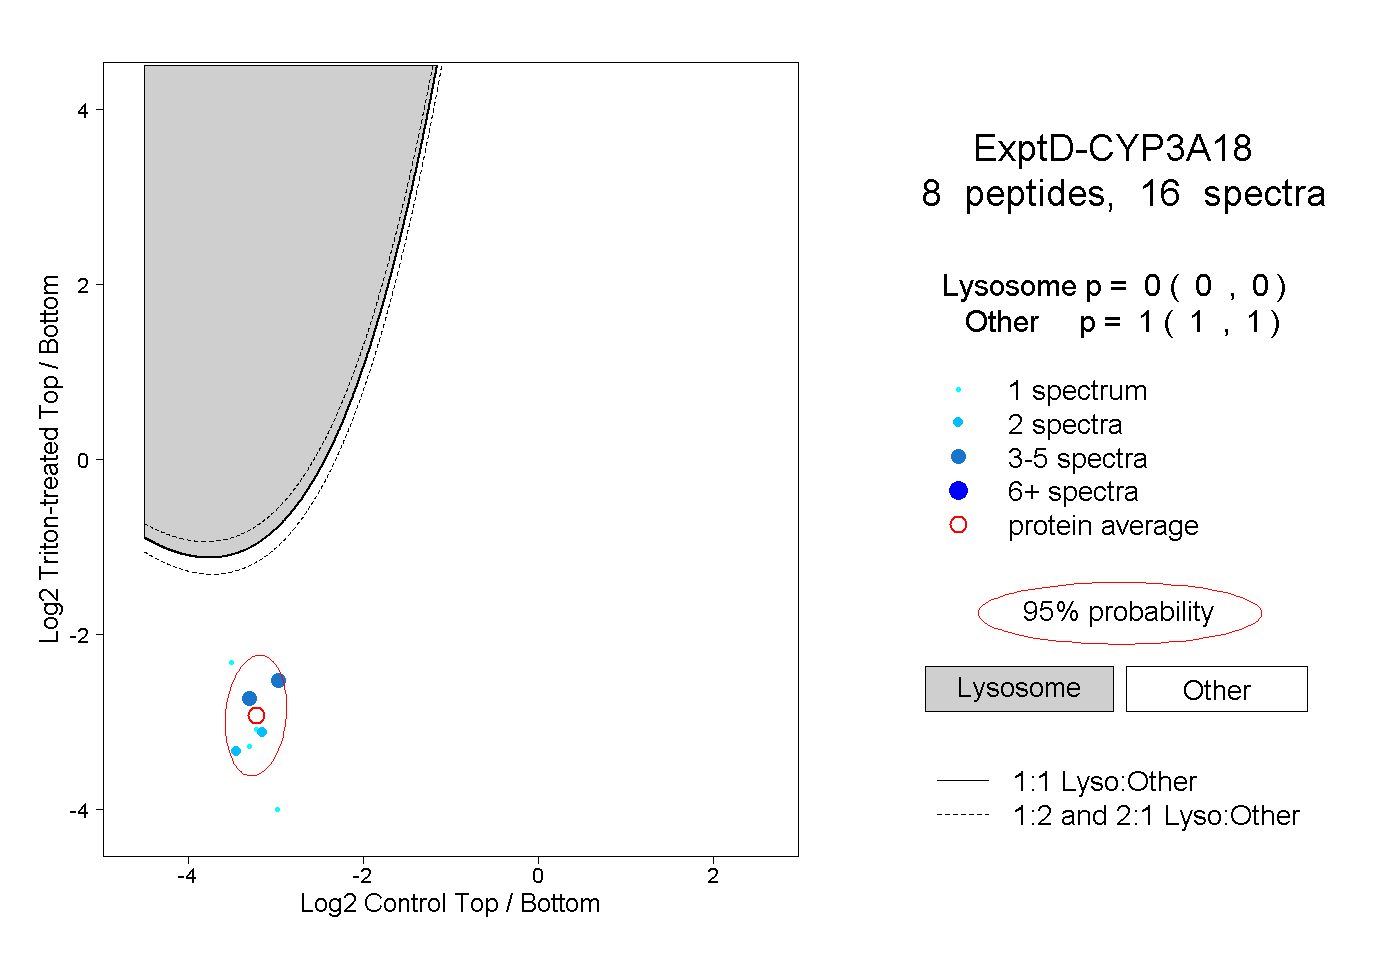 |
0.000 0.000 | 0.000 |
1.000 1.000 | 1.000 |