7
7peptides
spectra
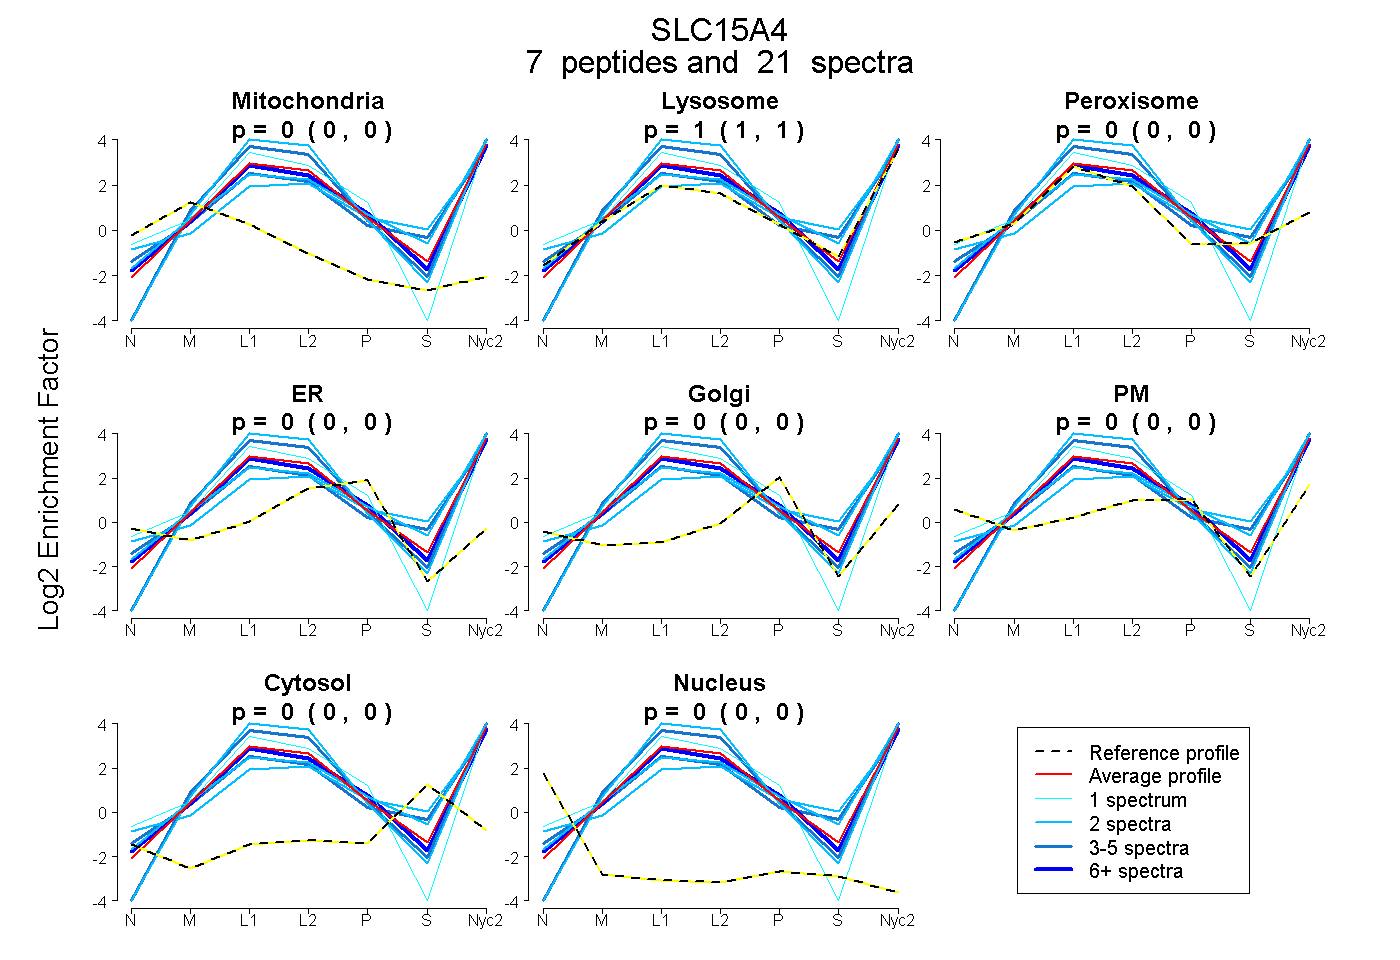
0.000 | 0.000
1.000 | 1.000
0.000 | 0.000
0.000 | 0.000
0.000 | 0.000
0.000 | 0.000
0.000 | 0.000
0.000 | 0.000
6peptides
spectra
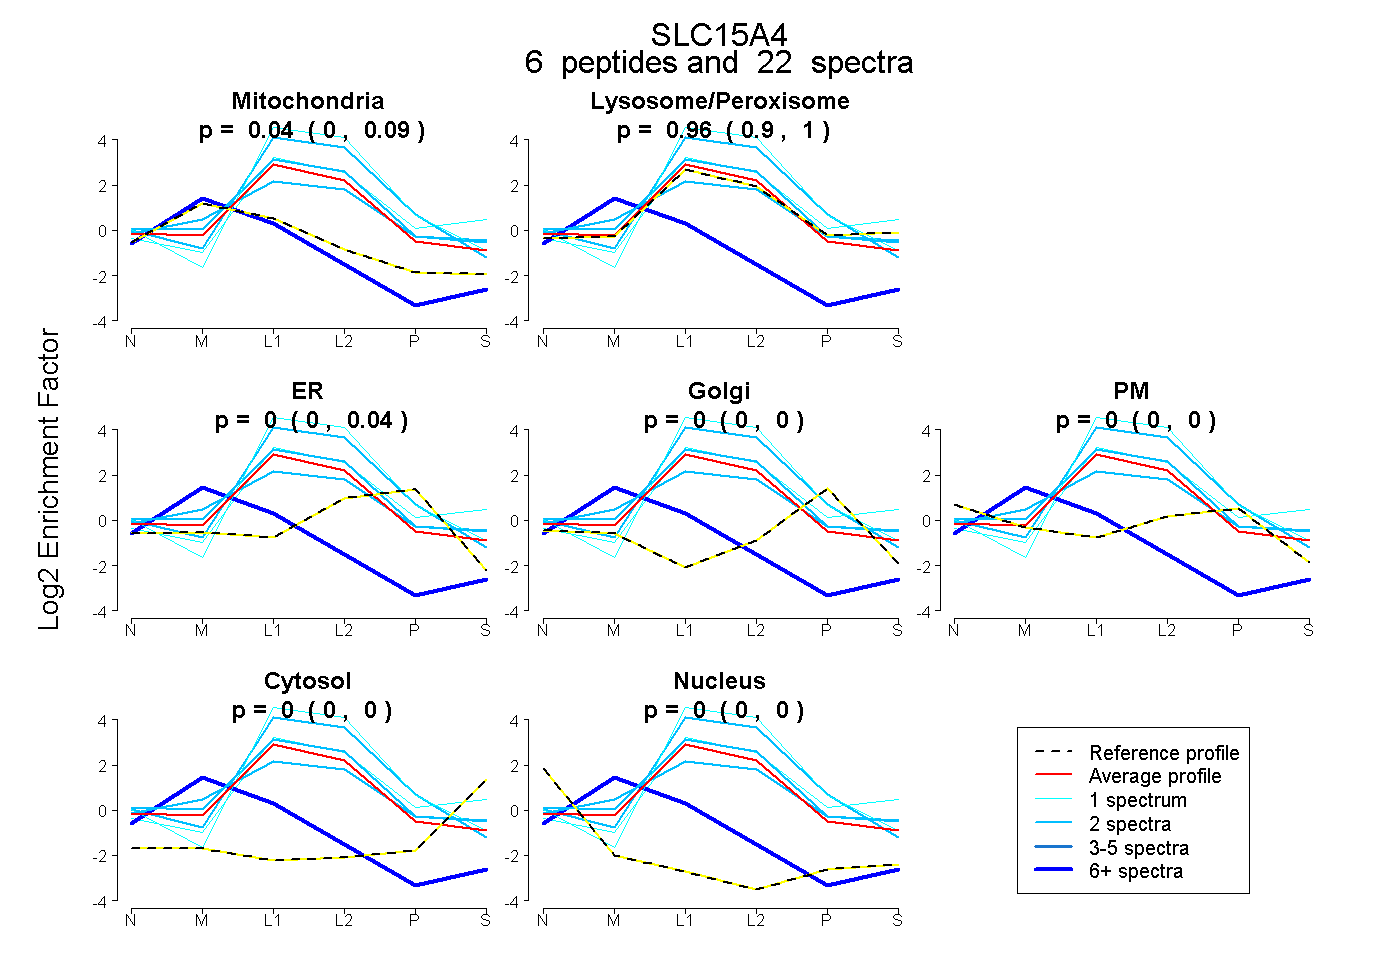
0.000 | 0.087
0.901 | 1.000
0.000 | 0.037
0.000 | 0.000
0.000 | 0.000
0.000 | 0.000
0.000 | 0.000
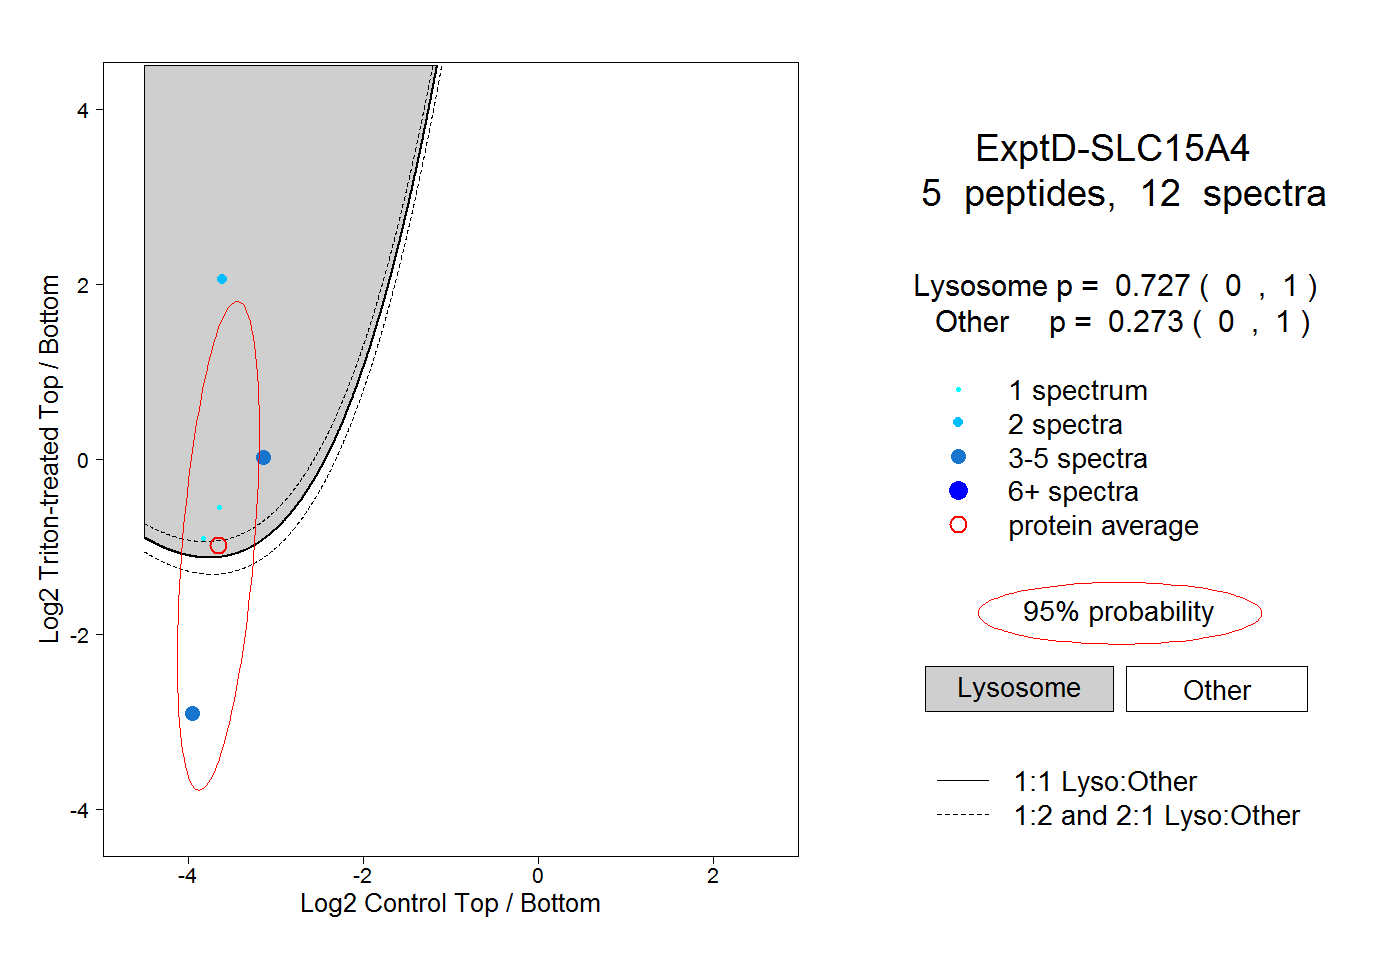
10peptides
spectra
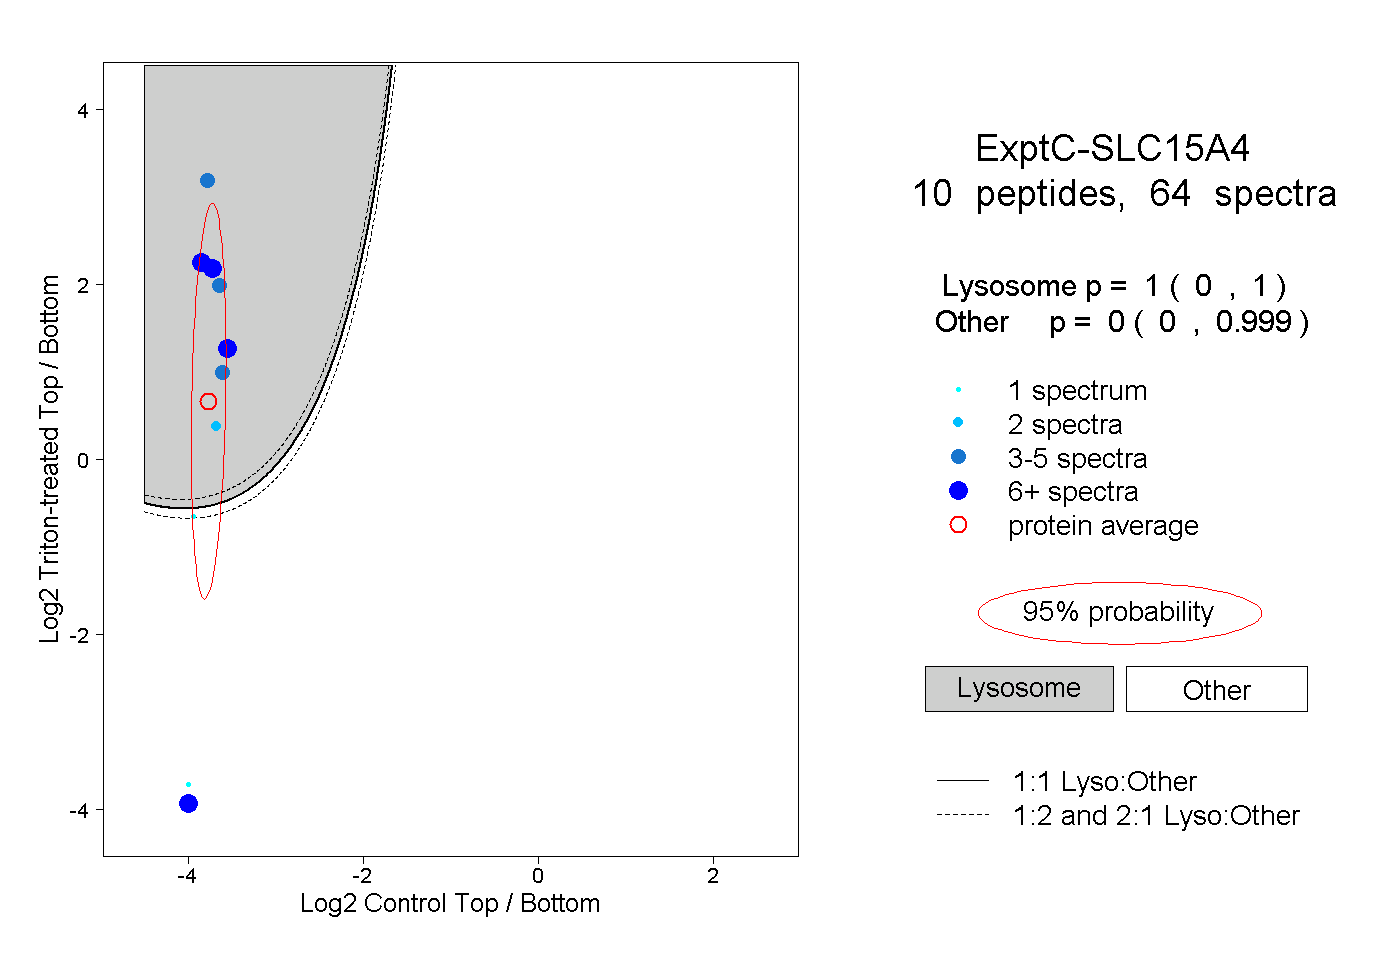
0.000 | 1.000
0.000 | 0.999