 7
7peptides
spectra
0.000 | 0.000
1.000 | 1.000
0.000 | 0.000
0.000 | 0.000
0.000 | 0.000
0.000 | 0.000
0.000 | 0.000
0.000 | 0.000
| Plot | Mito | Lyso | Perox | ER | Golgi | PM | Cytosol | Nucleus | |||||
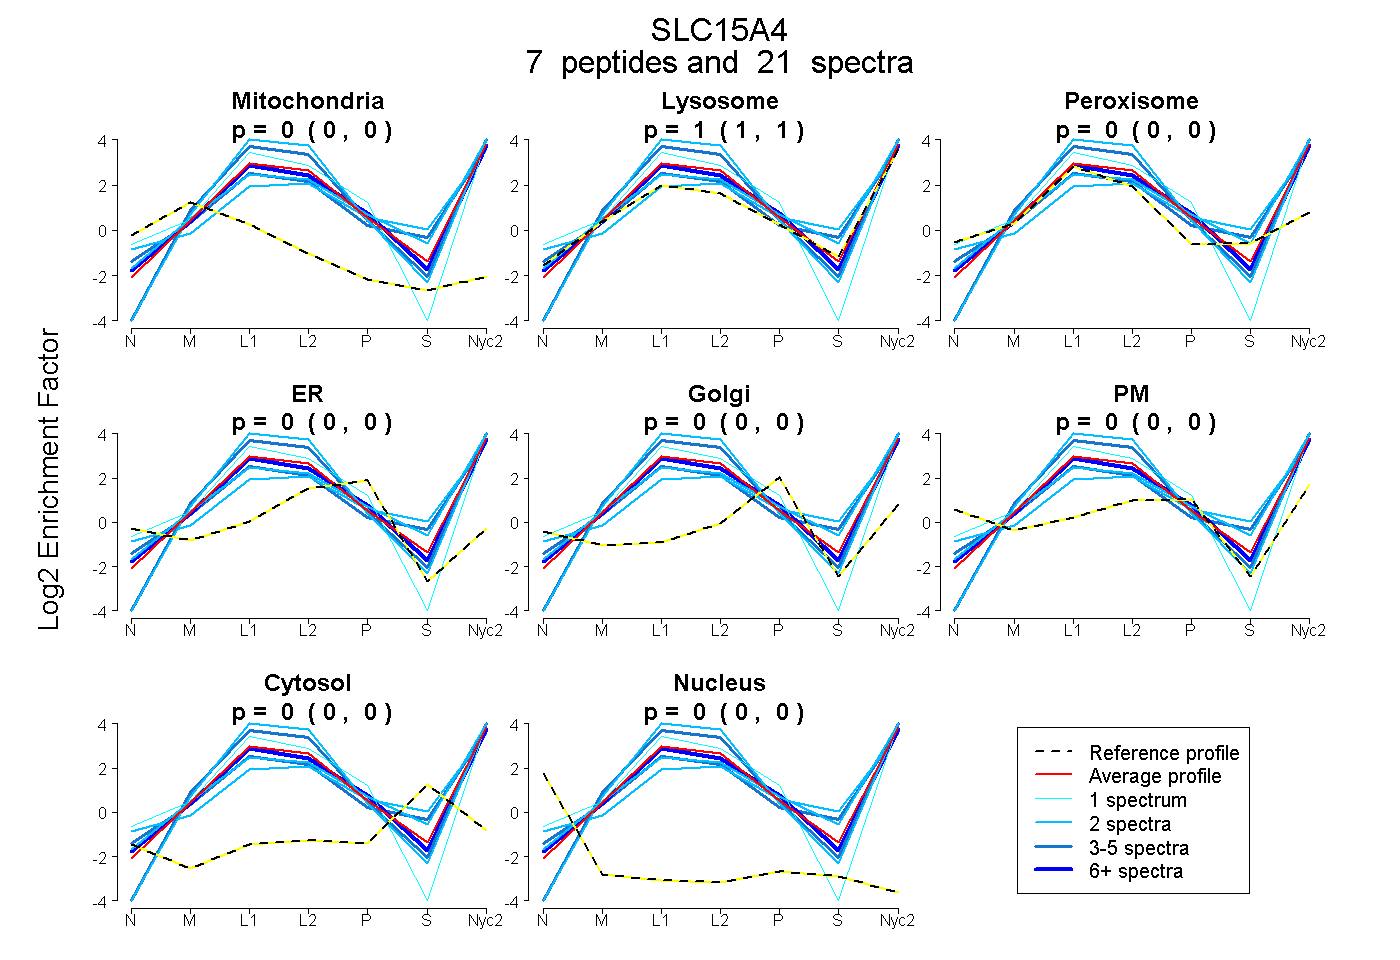
| Expt A |
7 peptides |
21 spectra |
|
0.000 0.000 | 0.000 |
1.000 1.000 | 1.000 |
0.000 0.000 | 0.000 |
0.000 0.000 | 0.000 |
0.000 0.000 | 0.000 |
0.000 0.000 | 0.000 |
0.000 0.000 | 0.000 |
0.000 0.000 | 0.000 |
| 5 spectra, AAAAAGVFAGR | 0.000 | 0.920 | 0.080 | 0.000 | 0.000 | 0.000 | 0.000 | 0.000 | ||
| 2 spectra, TDGGTASTR | 0.000 | 1.000 | 0.000 | 0.000 | 0.000 | 0.000 | 0.000 | 0.000 | ||
| 6 spectra, ILTYSCCSQR | 0.000 | 1.000 | 0.000 | 0.000 | 0.000 | 0.000 | 0.000 | 0.000 | ||
| 1 spectrum, SGEGLGVFQQSSK | 0.000 | 0.852 | 0.000 | 0.000 | 0.000 | 0.148 | 0.000 | 0.000 | ||
| 2 spectra, SFLCGDPHPELVR | 0.000 | 1.000 | 0.000 | 0.000 | 0.000 | 0.000 | 0.000 | 0.000 | ||
| 3 spectra, LVDPVLR | 0.000 | 1.000 | 0.000 | 0.000 | 0.000 | 0.000 | 0.000 | 0.000 | ||
| 2 spectra, HSLFDSCK | 0.000 | 0.894 | 0.071 | 0.000 | 0.000 | 0.000 | 0.035 | 0.000 |
| Plot | Mito | Lyso or Perox | ER | Golgi | PM | Cytosol | Nucleus | ||||||
| Expt B |
6 peptides |
22 spectra |
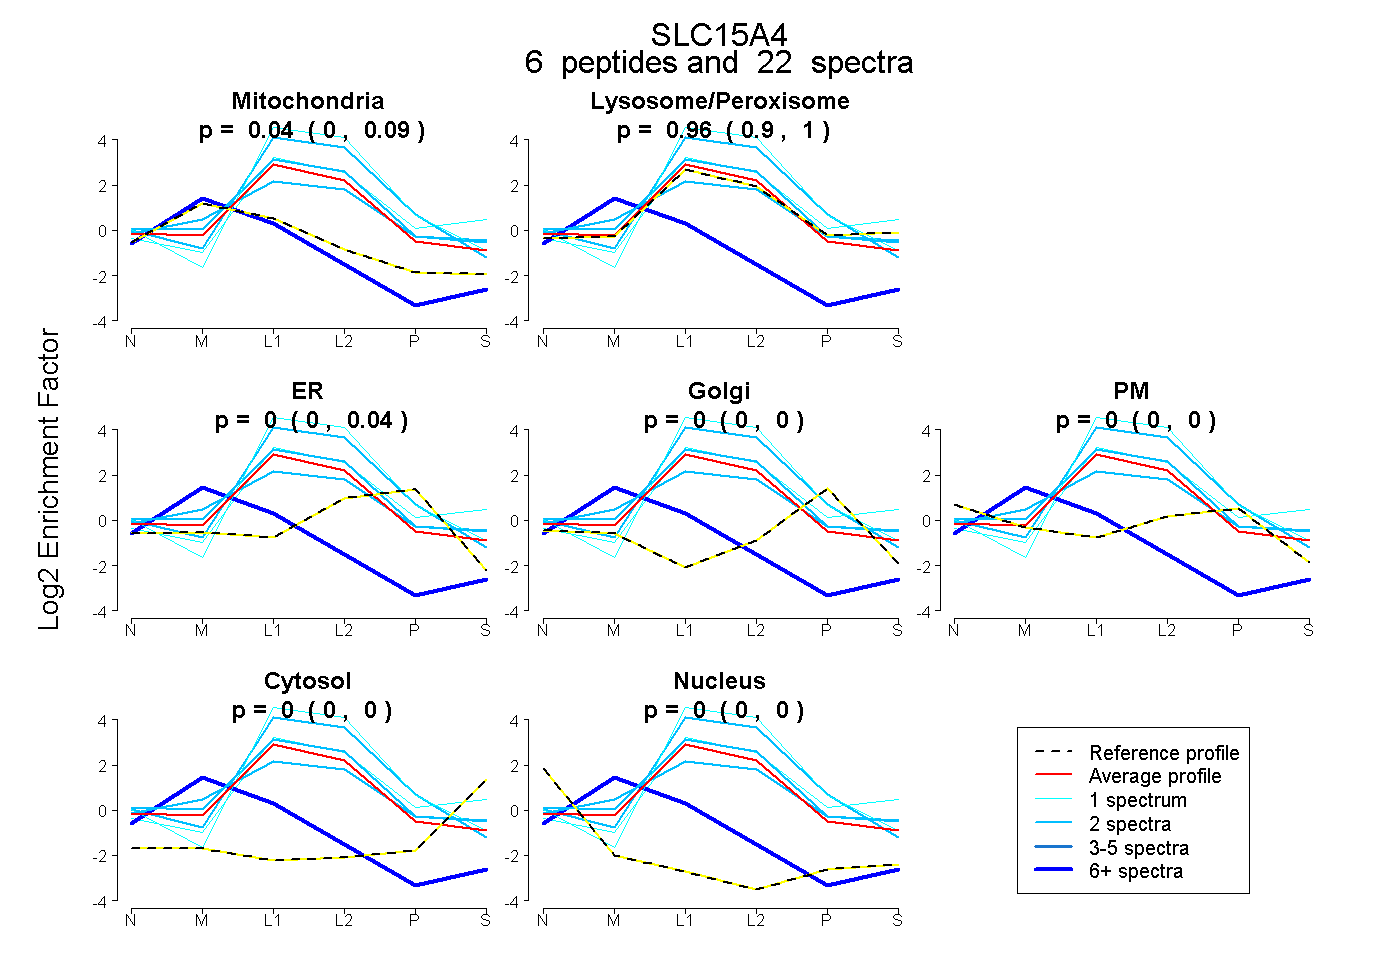 |
0.037 0.000 | 0.087 |
0.963 0.901 | 1.000 |
0.000 0.000 | 0.037 |
0.000 0.000 | 0.000 |
0.000 0.000 | 0.000 |
0.000 0.000 | 0.000 |
0.000 0.000 | 0.000 |
|||
| Plot | Lyso | Other | |||||||||||
| Expt C |
10 peptides |
64 spectra |
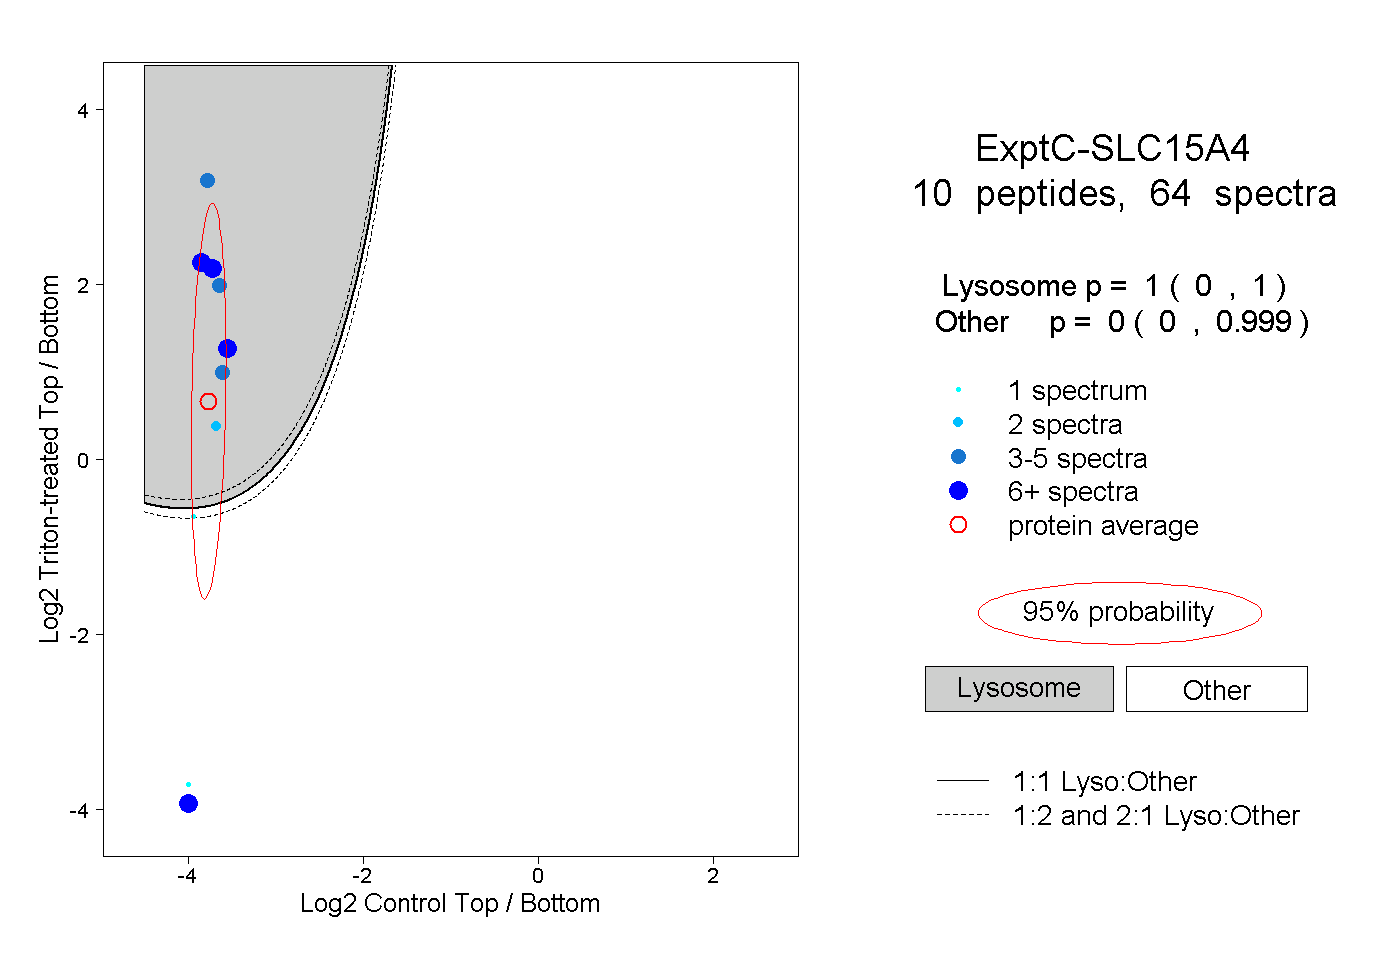 |
1.000 0.000 | 1.000 |
0.000 0.000 | 0.999 |
||||||||
| Plot | Lyso | Other | |||||||||||
| Expt D |
5 peptides |
12 spectra |
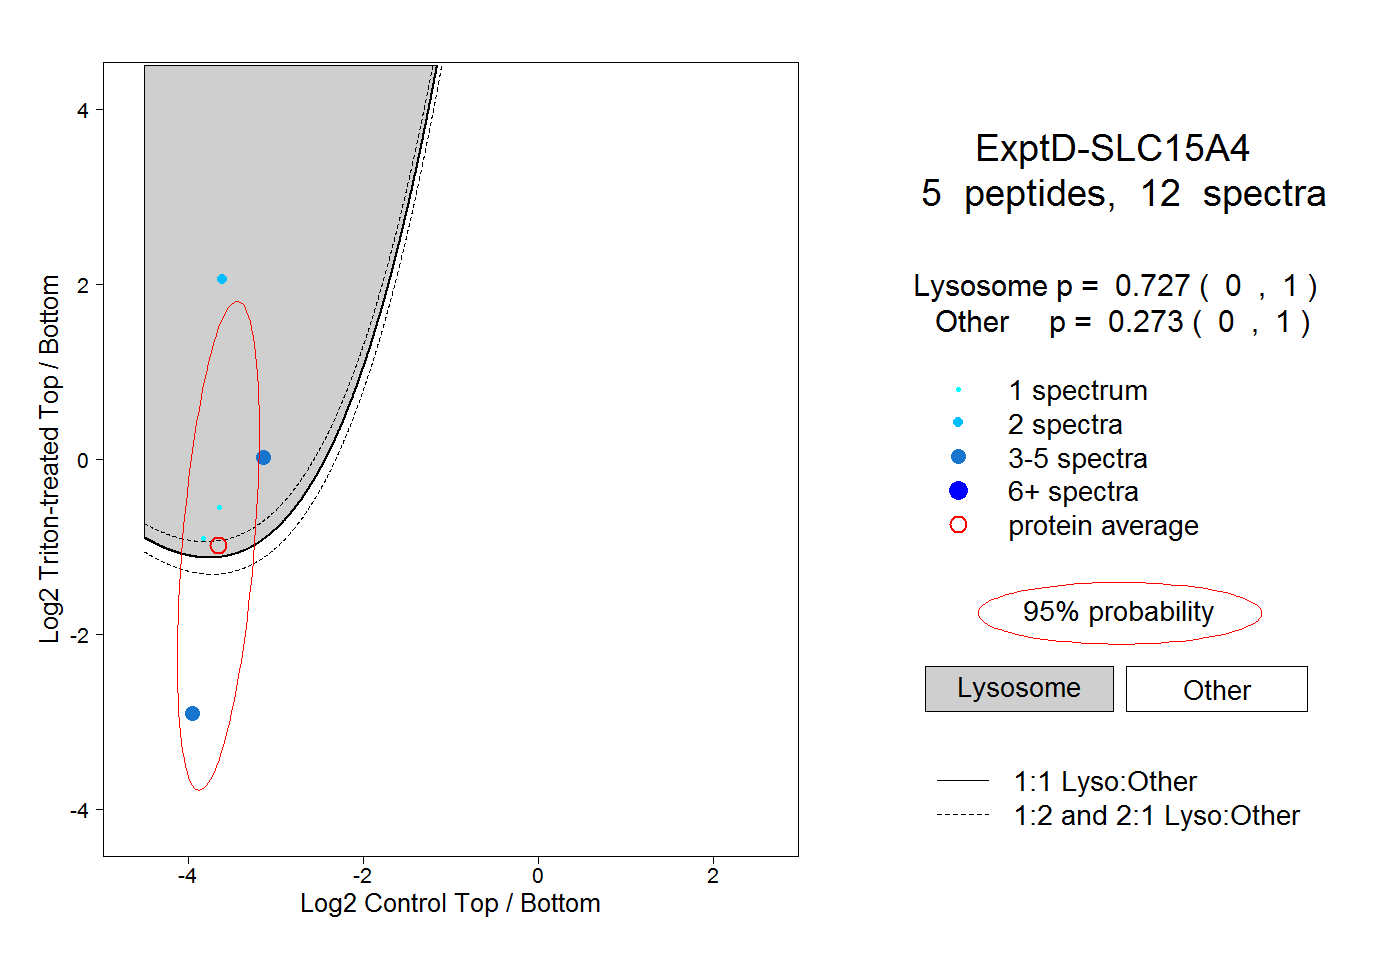 |
0.727 0.000 | 1.000 |
0.273 0.000 | 1.000 |