 3
3peptides
spectra

0.000 | 0.883
0.000 | 0.451
0.000 | 0.516
0.000 | 0.080
0.000 | 0.000
0.000 | 0.000
0.000 | 0.286
0.000 | 0.324
1peptide
spectrum
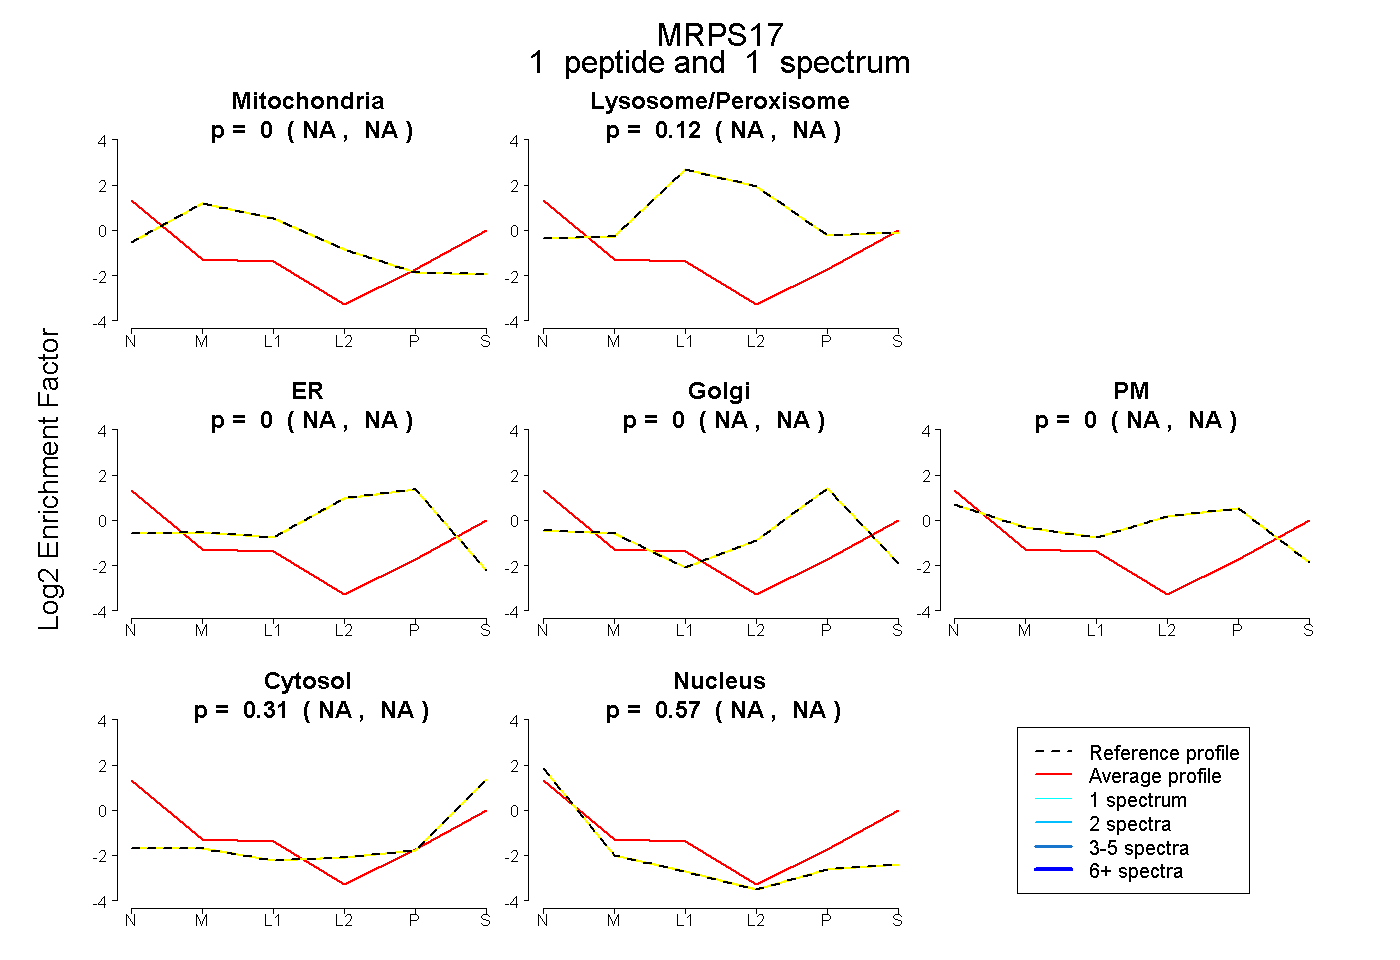
NA | NA
NA | NA
NA | NA
NA | NA
NA | NA
NA | NA
NA | NA
4peptides
spectra
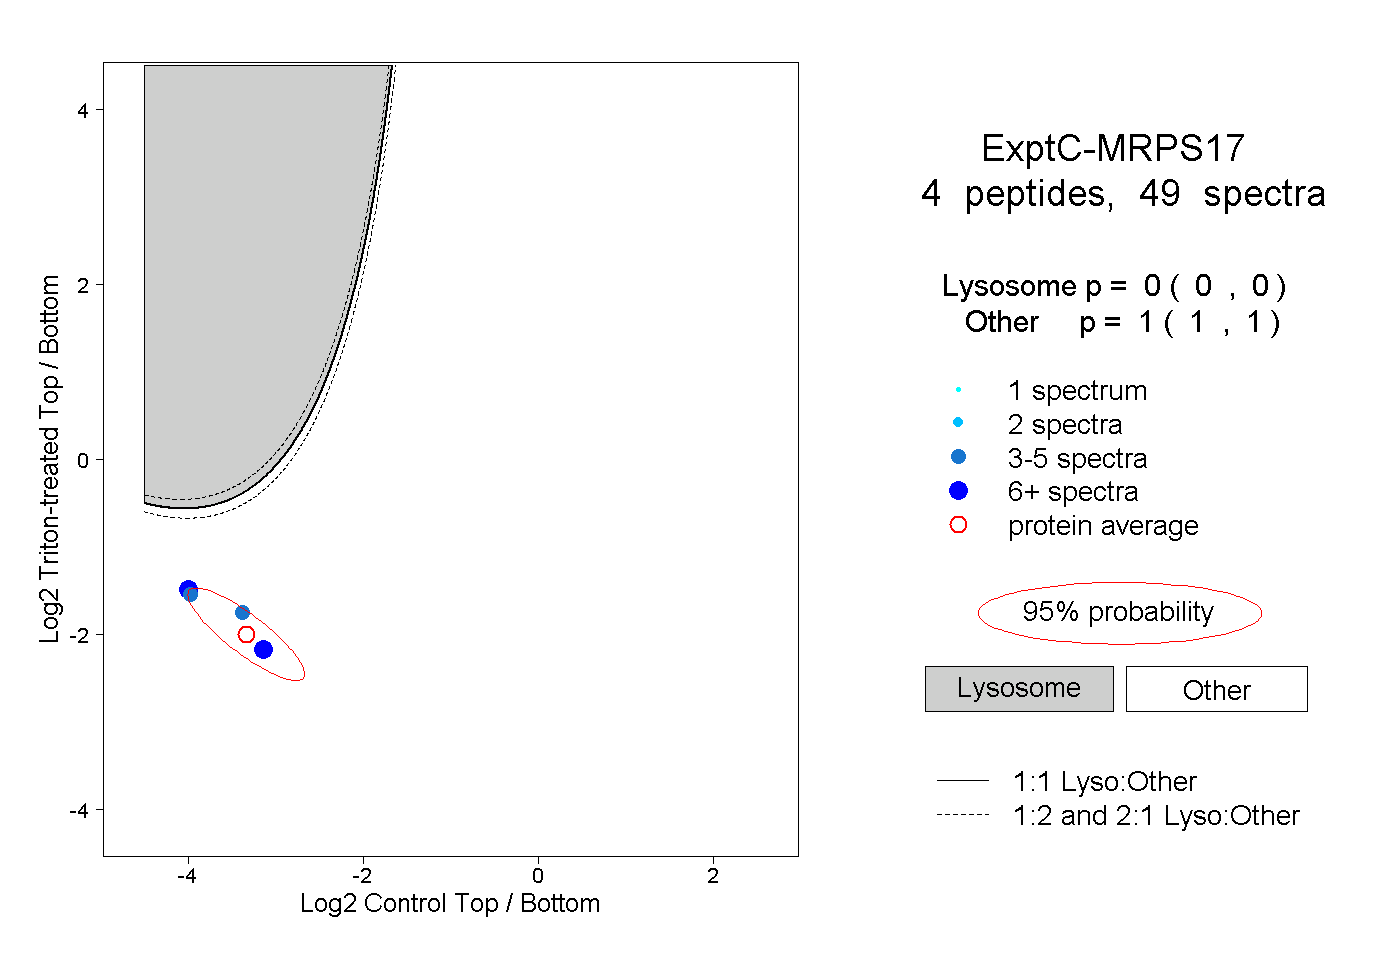
0.000 | 0.000
1.000 | 1.000