 6
6peptides
spectra
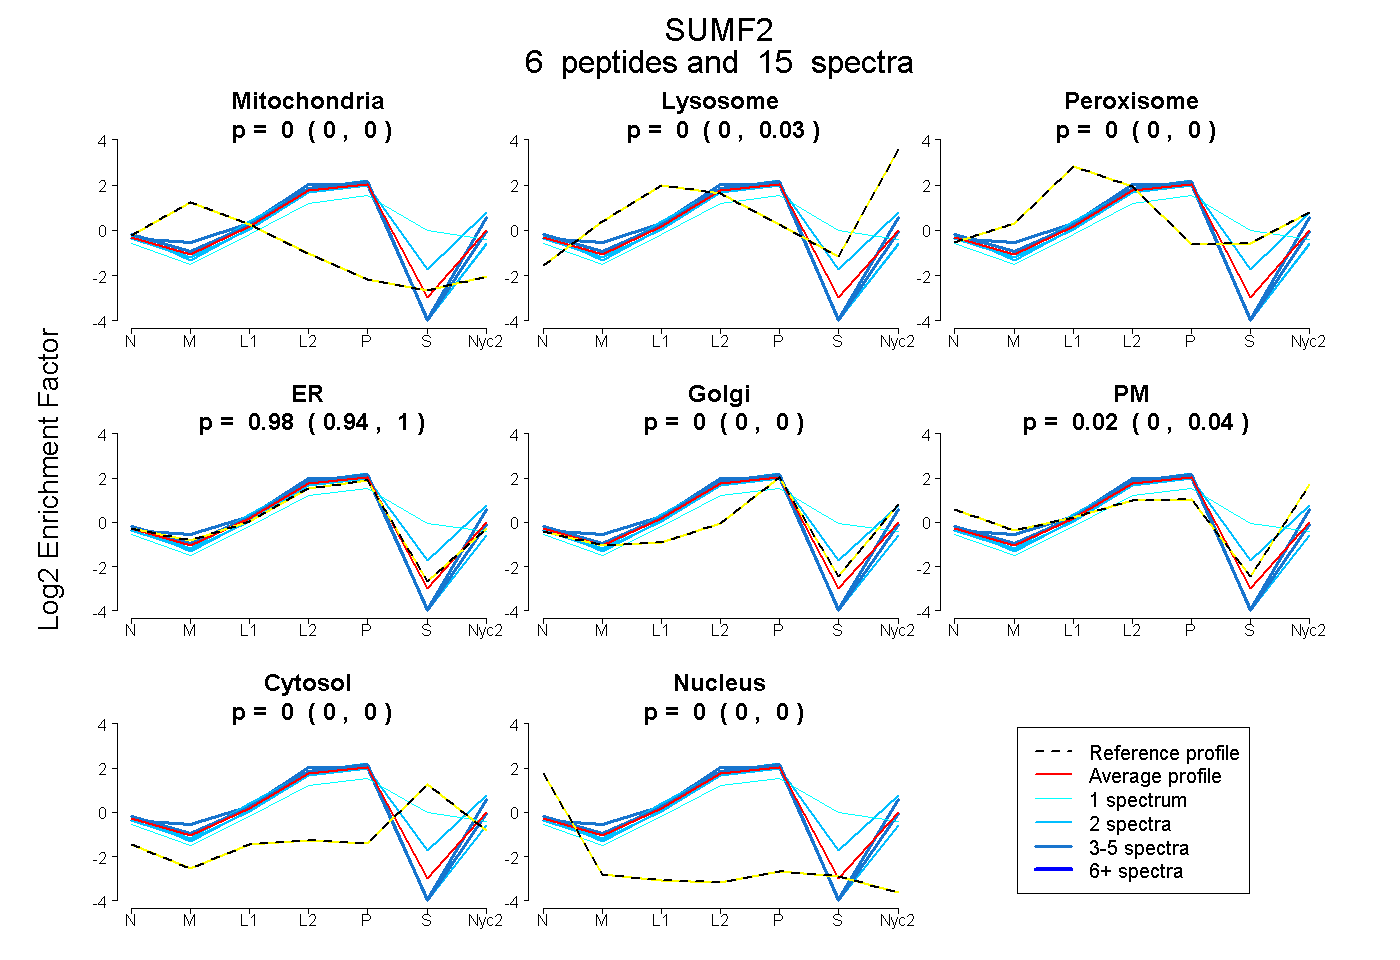
0.000 | 0.000
0.000 | 0.029
0.000 | 0.000
0.945 | 1.000
0.000 | 0.000
0.000 | 0.043
0.000 | 0.000
0.000 | 0.000
1peptide
spectrum
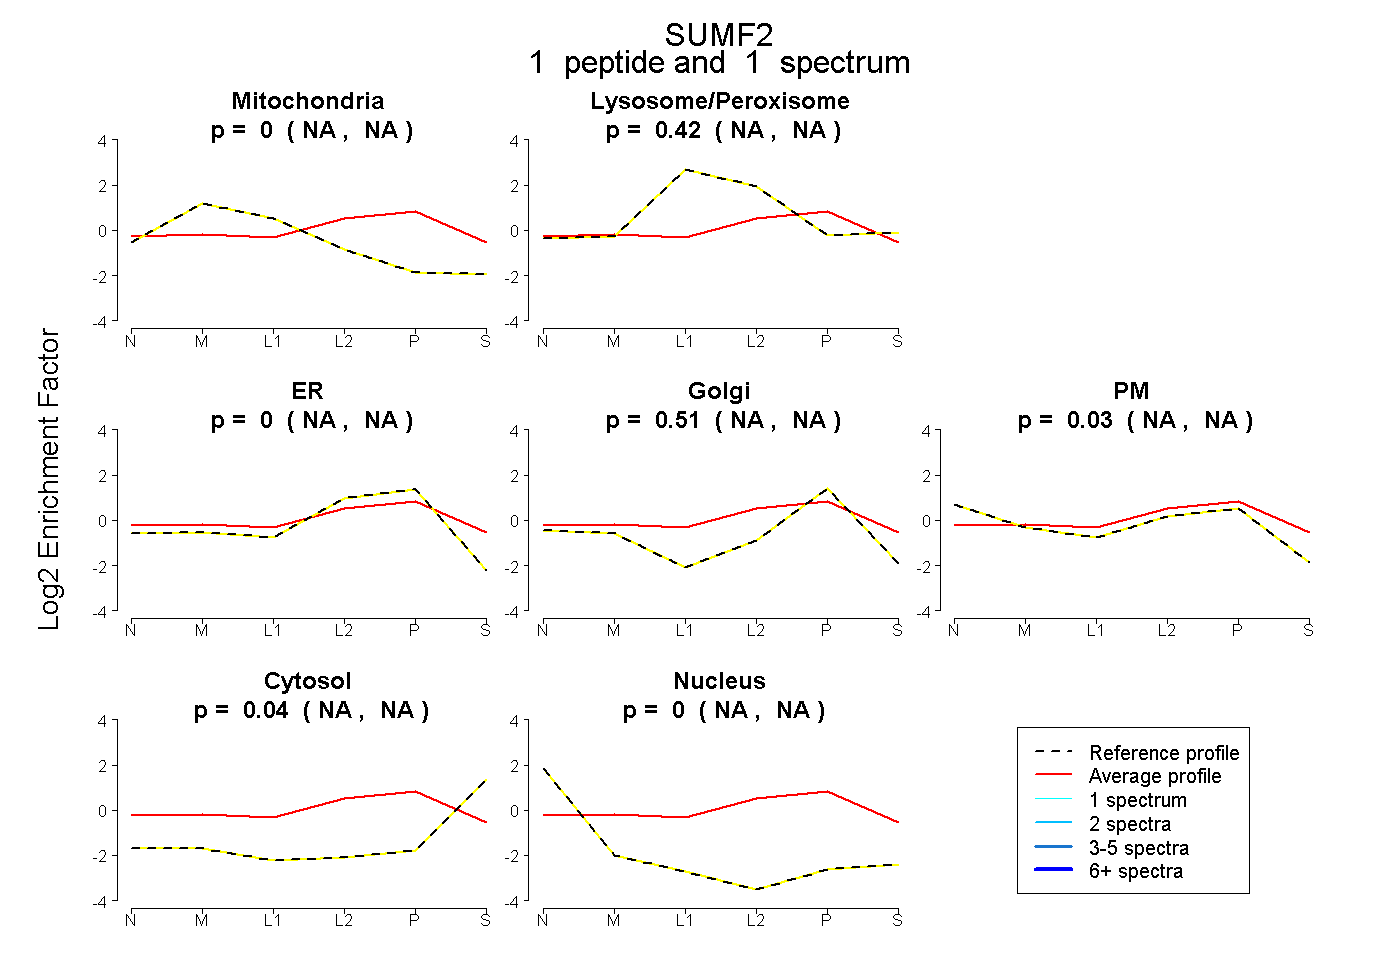
NA | NA
NA | NA
NA | NA
NA | NA
NA | NA
NA | NA
NA | NA
6peptides
spectra
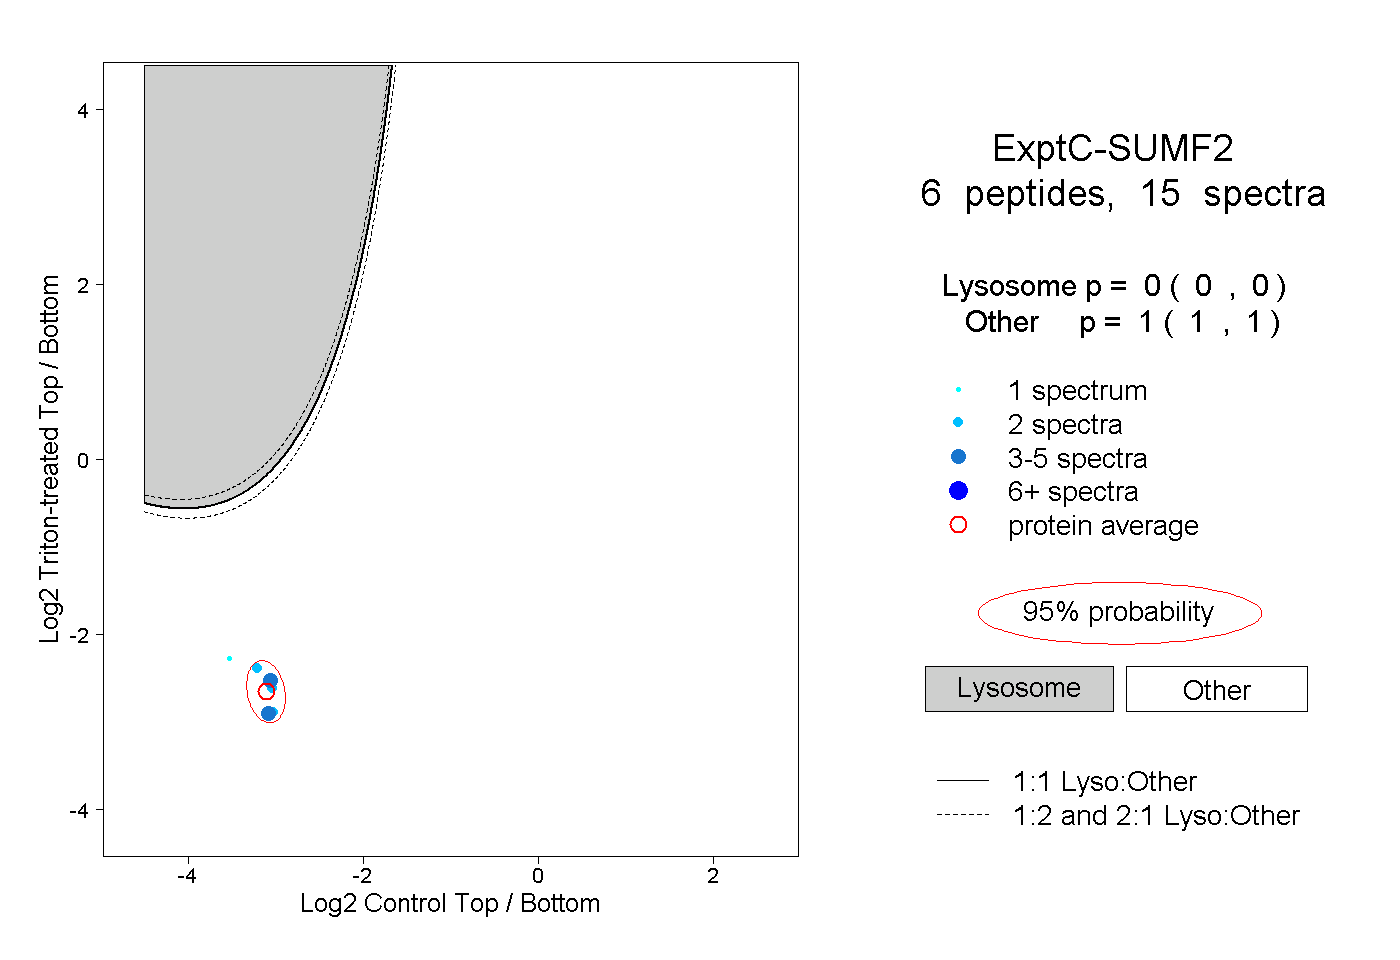
0.000 | 0.000
1.000 | 1.000
1peptide
spectra
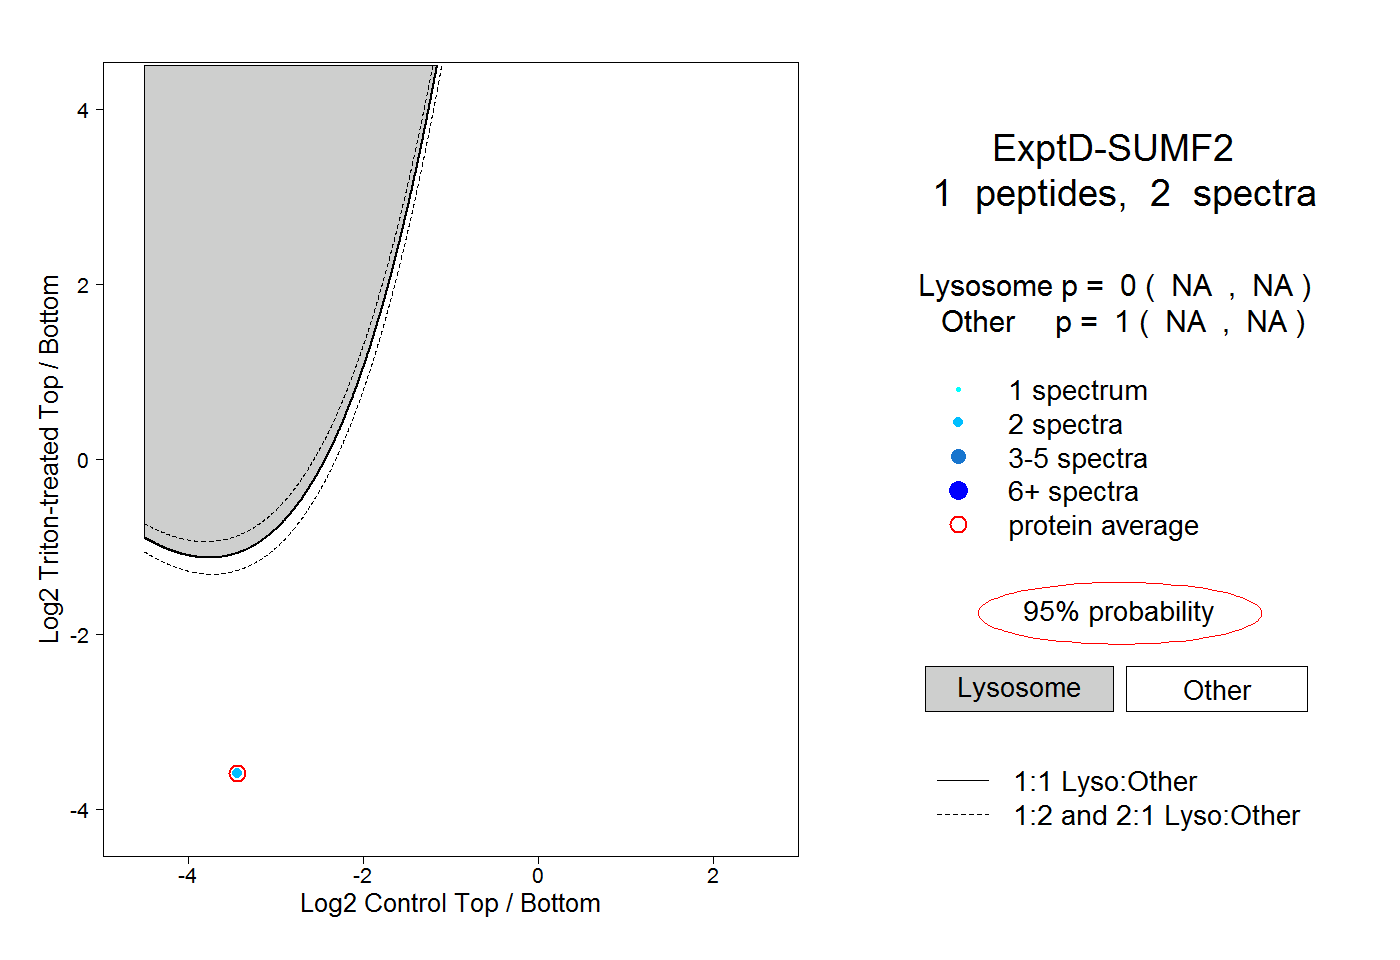
NA | NA
NA | NA