 6
6peptides
spectra
0.000 | 0.000
0.000 | 0.029
0.000 | 0.000
0.945 | 1.000
0.000 | 0.000
0.000 | 0.043
0.000 | 0.000
0.000 | 0.000
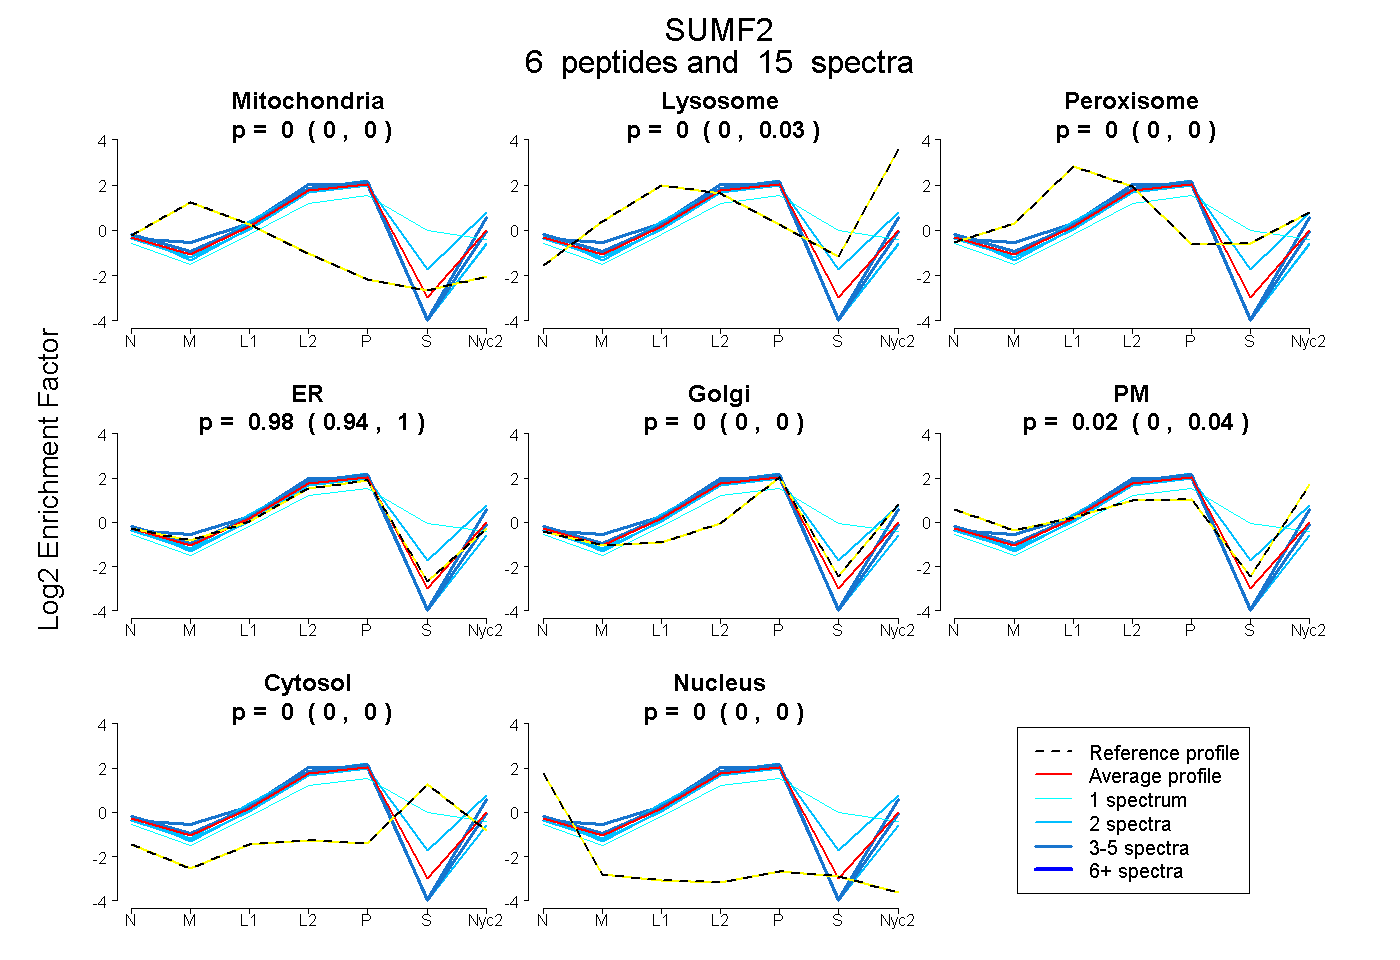
| Plot | Mito | Lyso | Perox | ER | Golgi | PM | Cytosol | Nucleus | |||||
| Expt A |
6 peptides |
15 spectra |
|
0.000 0.000 | 0.000 |
0.004 0.000 | 0.029 |
0.000 0.000 | 0.000 |
0.980 0.945 | 1.000 |
0.000 0.000 | 0.000 |
0.016 0.000 | 0.043 |
0.000 0.000 | 0.000 |
0.000 0.000 | 0.000 |
| 4 spectra, QPAGPGSGIR | 0.000 | 0.000 | 0.000 | 1.000 | 0.000 | 0.000 | 0.000 | 0.000 | ||
| 2 spectra, MGNTPDSASDNLGFR | 0.000 | 0.167 | 0.000 | 0.654 | 0.142 | 0.000 | 0.037 | 0.000 | ||
| 1 spectrum, TNLWQGK | 0.000 | 0.000 | 0.086 | 0.581 | 0.000 | 0.000 | 0.333 | 0.000 | ||
| 2 spectra, LPTEEEWEFAAR | 0.000 | 0.000 | 0.000 | 1.000 | 0.000 | 0.000 | 0.000 | 0.000 | ||
| 2 spectra, DGEGPAR | 0.000 | 0.000 | 0.000 | 1.000 | 0.000 | 0.000 | 0.000 | 0.000 | ||
| 4 spectra, FLMGTNAPDGR | 0.000 | 0.020 | 0.000 | 0.827 | 0.000 | 0.153 | 0.000 | 0.000 |
| Plot | Mito | Lyso or Perox | ER | Golgi | PM | Cytosol | Nucleus | ||||||
| Expt B |
1 peptide |
1 spectrum |
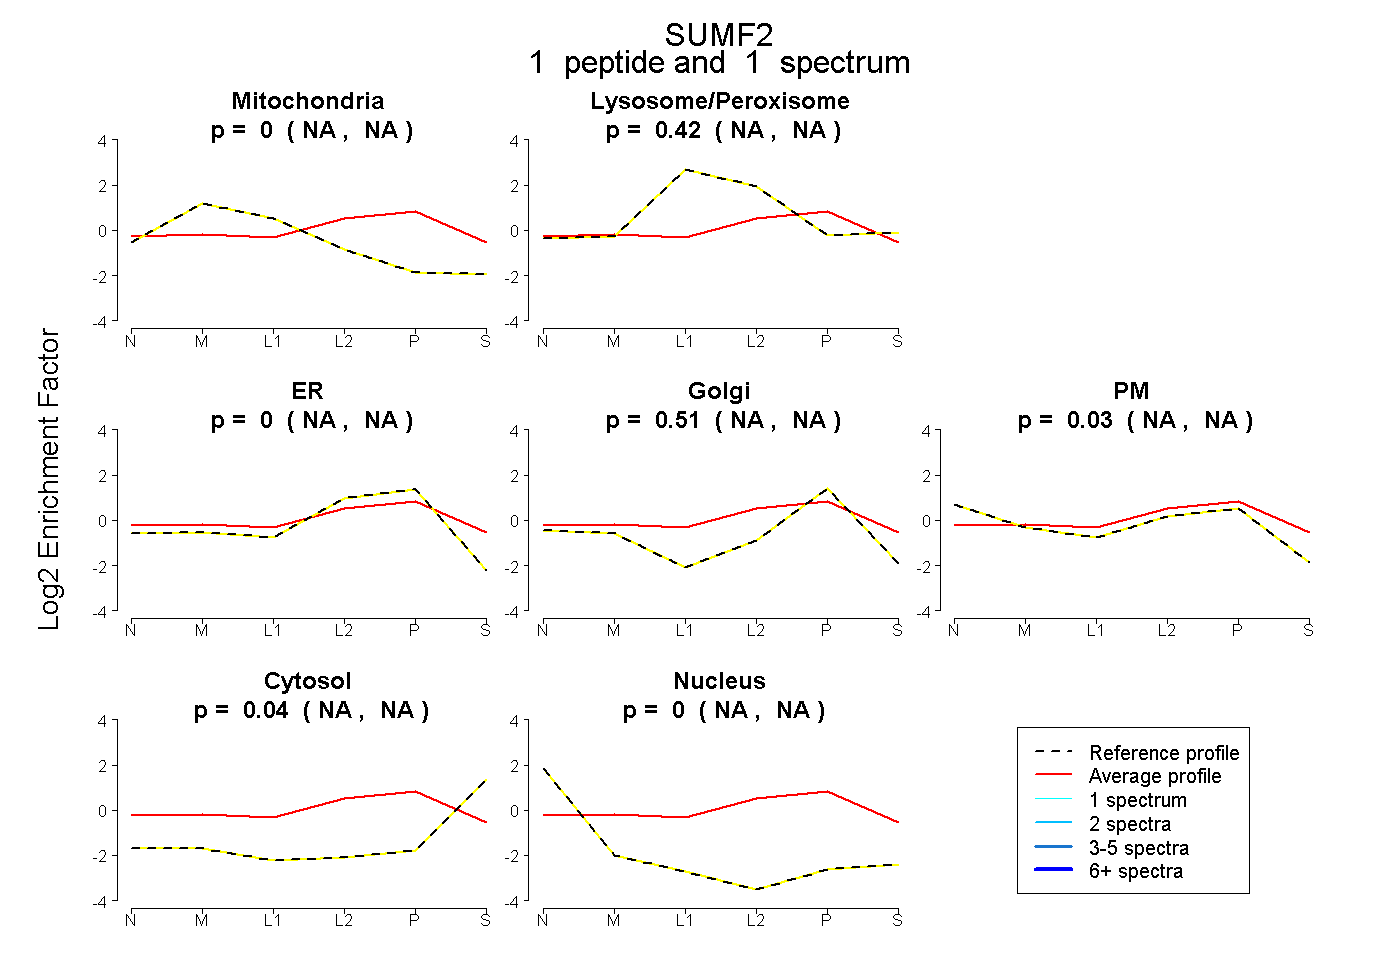 |
0.000 NA | NA |
0.420 NA | NA |
0.000 NA | NA |
0.513 NA | NA |
0.027 NA | NA |
0.040 NA | NA |
0.000 NA | NA |
|||
| Plot | Lyso | Other | |||||||||||
| Expt C |
6 peptides |
15 spectra |
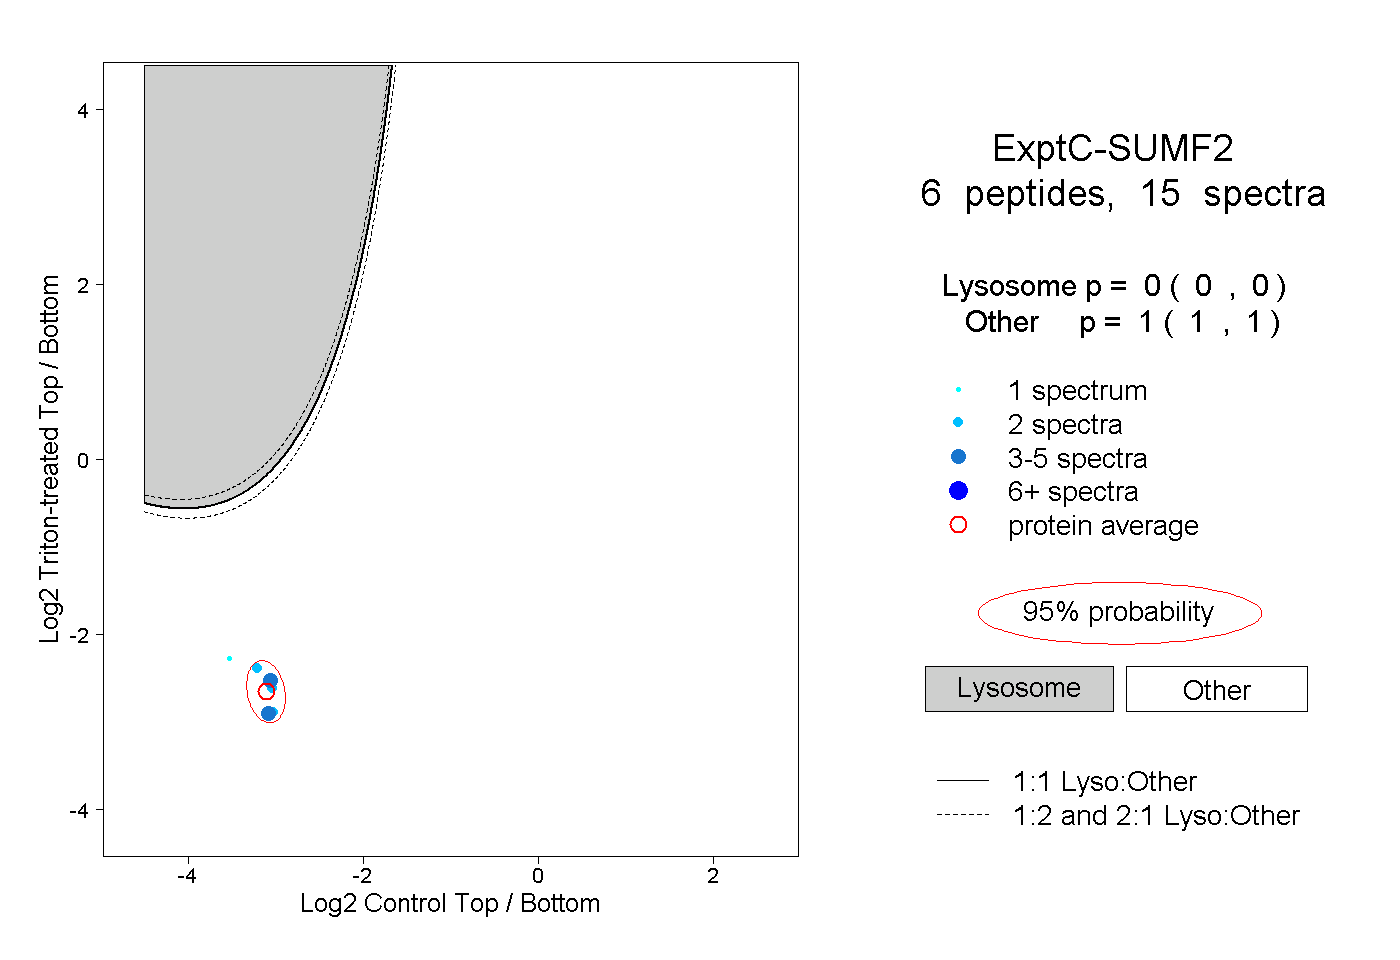 |
0.000 0.000 | 0.000 |
1.000 1.000 | 1.000 |
||||||||
| Plot | Lyso | Other | |||||||||||
| Expt D |
1 peptide |
2 spectra |
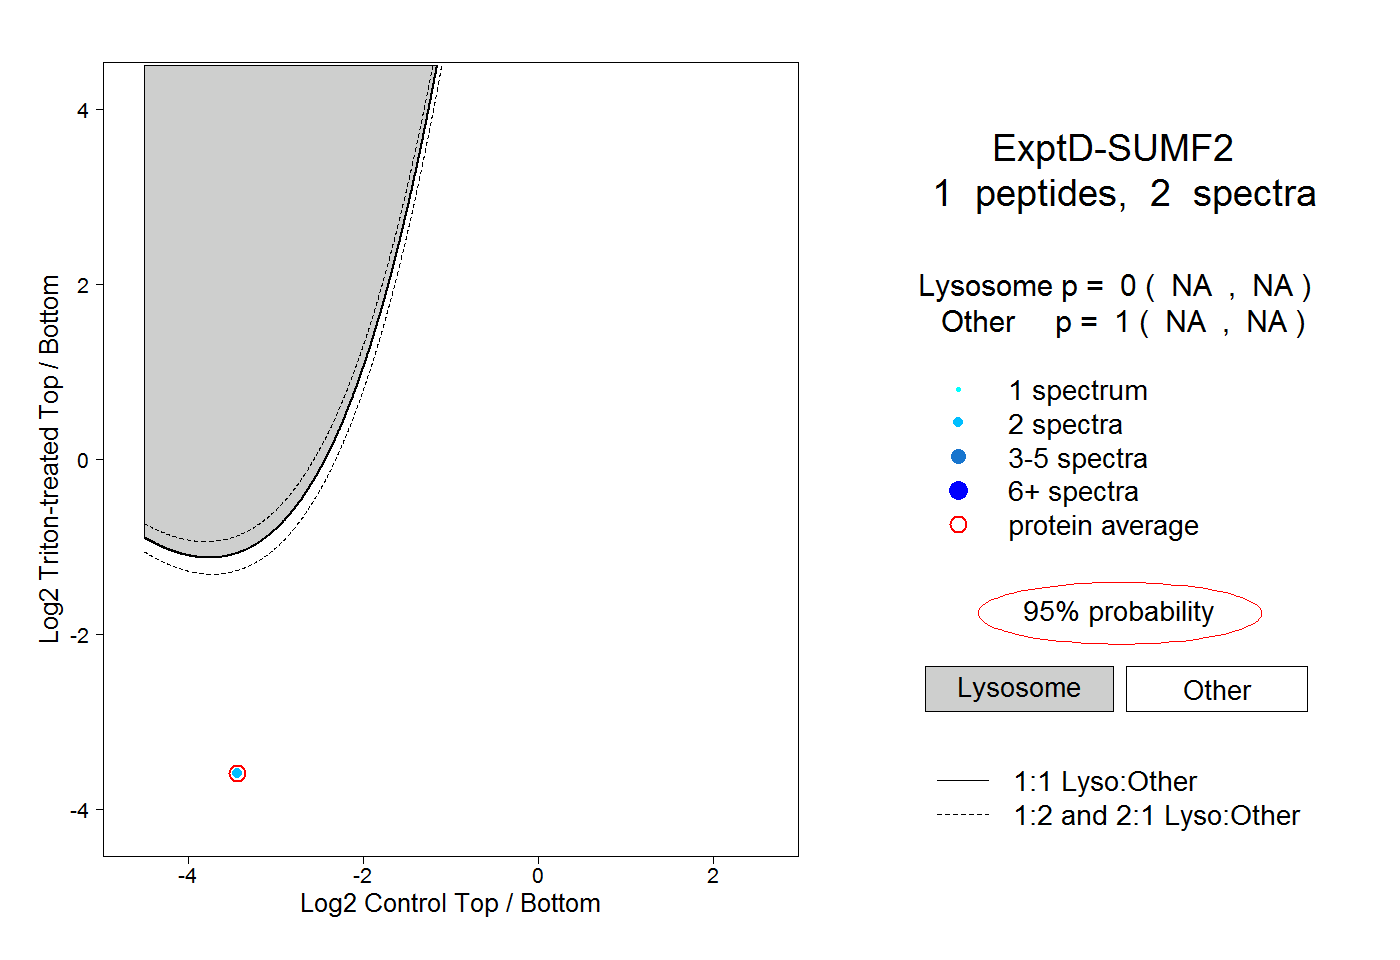 |
0.000 NA | NA |
1.000 NA | NA |