 27
27peptides
spectra
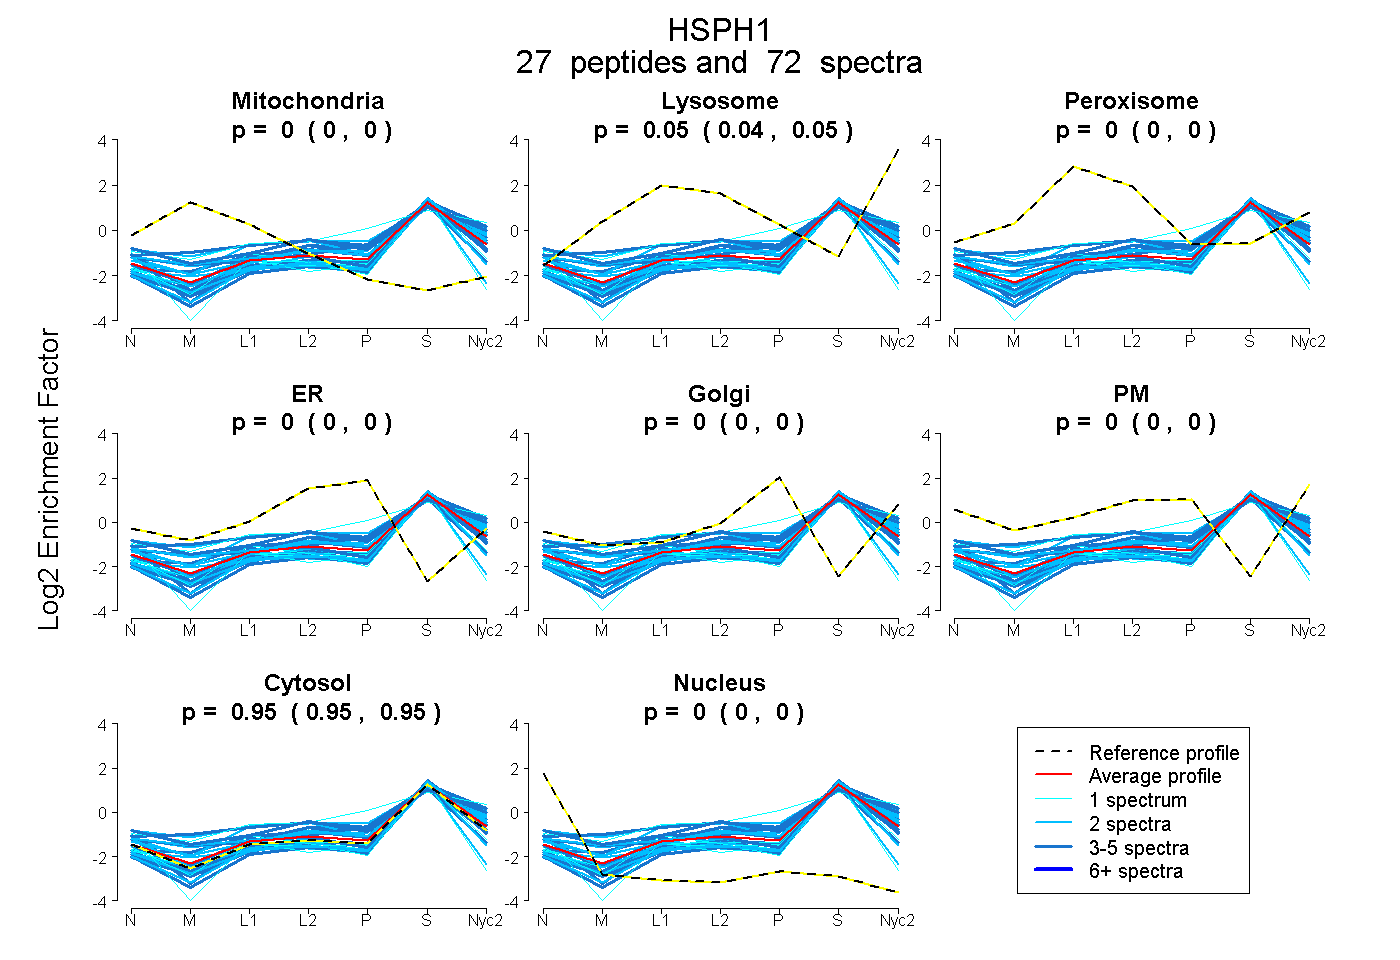
0.000 | 0.000
0.042 | 0.050
0.000 | 0.004
0.000 | 0.000
0.000 | 0.000
0.000 | 0.000
0.949 | 0.955
0.000 | 0.000
13peptides
spectra
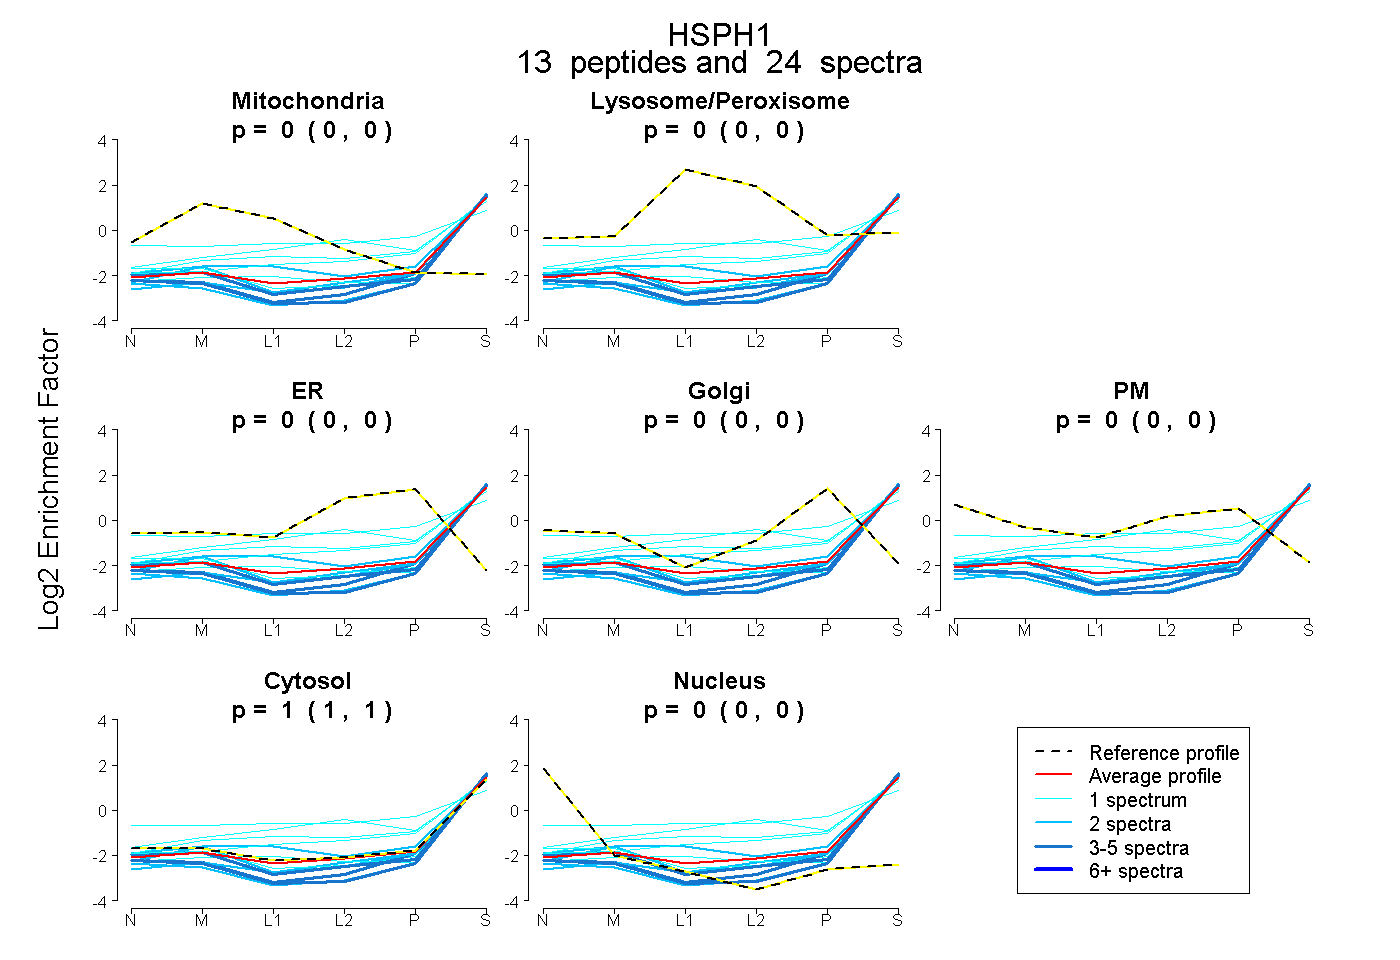
0.000 | 0.000
0.000 | 0.000
0.000 | 0.000
0.000 | 0.000
0.000 | 0.000
1.000 | 1.000
0.000 | 0.000
27peptides
spectra
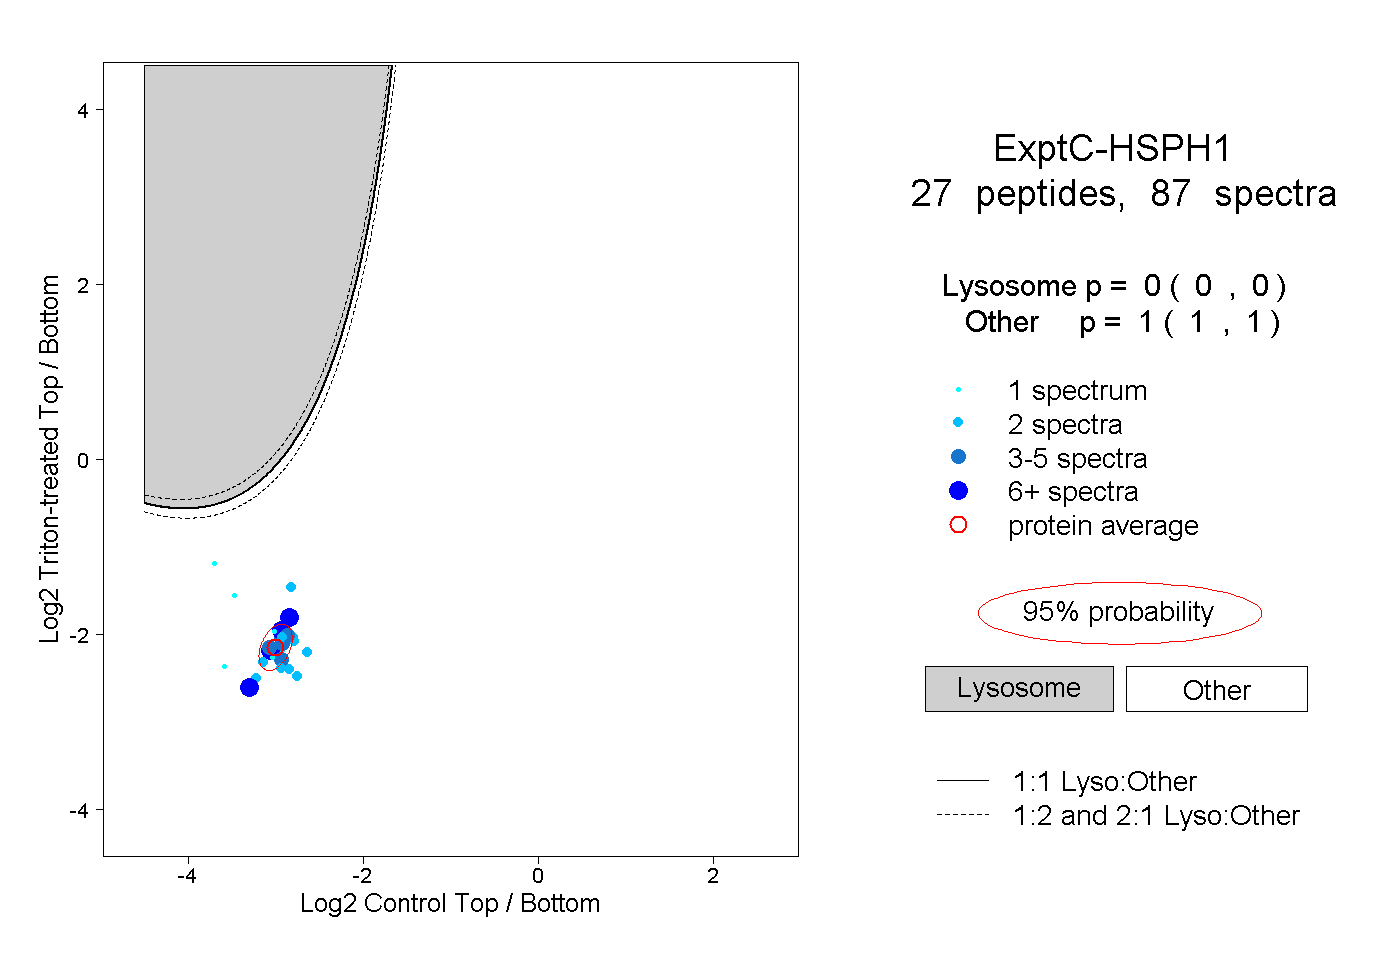
0.000 | 0.000
1.000 | 1.000
8peptides
spectra
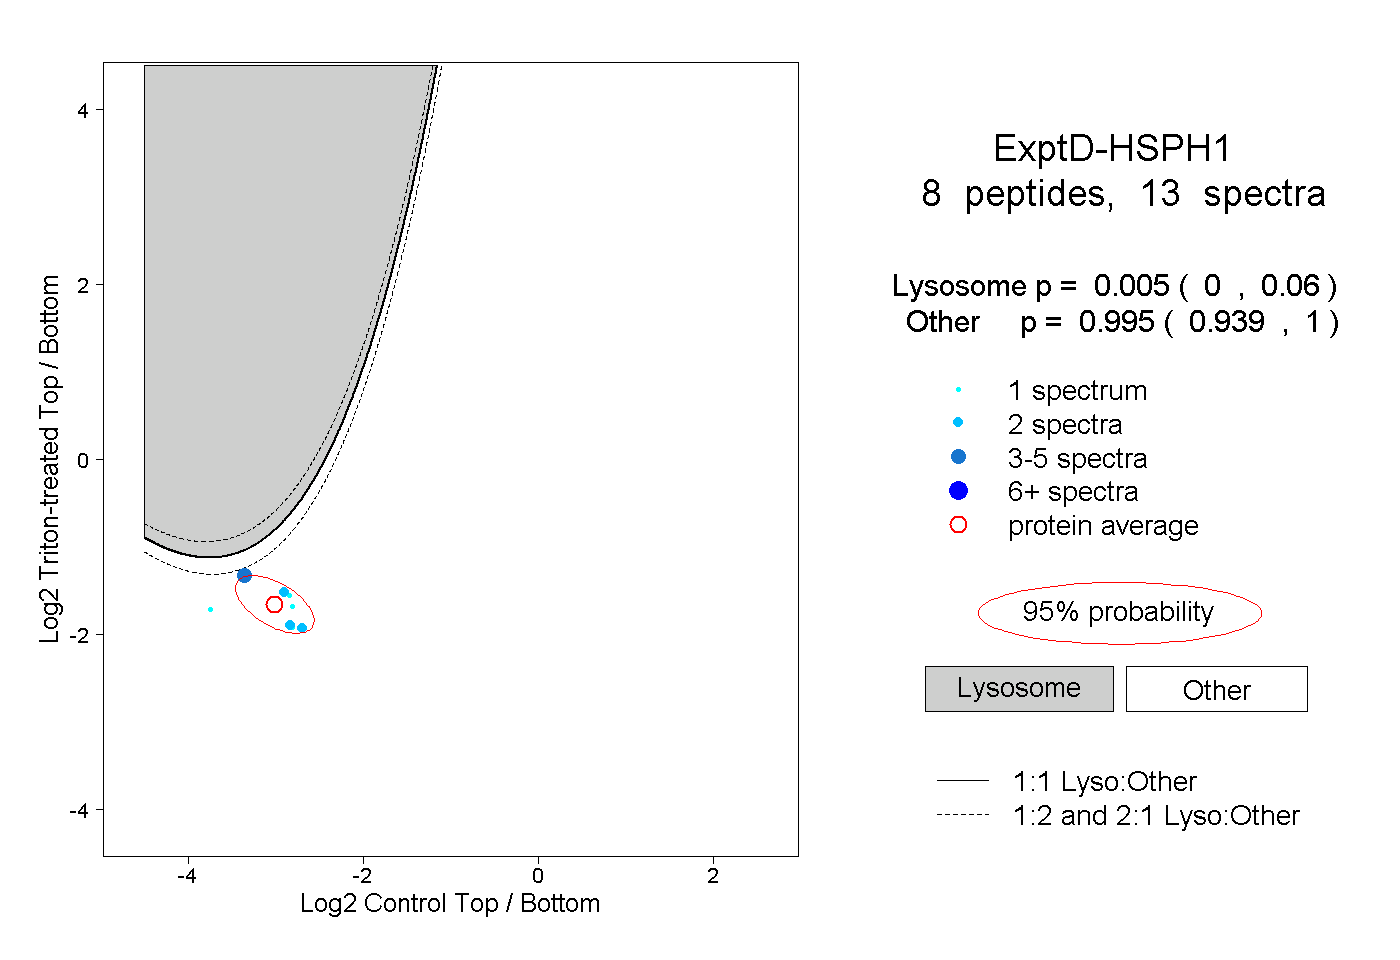
0.000 | 0.060
0.939 | 1.000