 5
5peptides
spectra
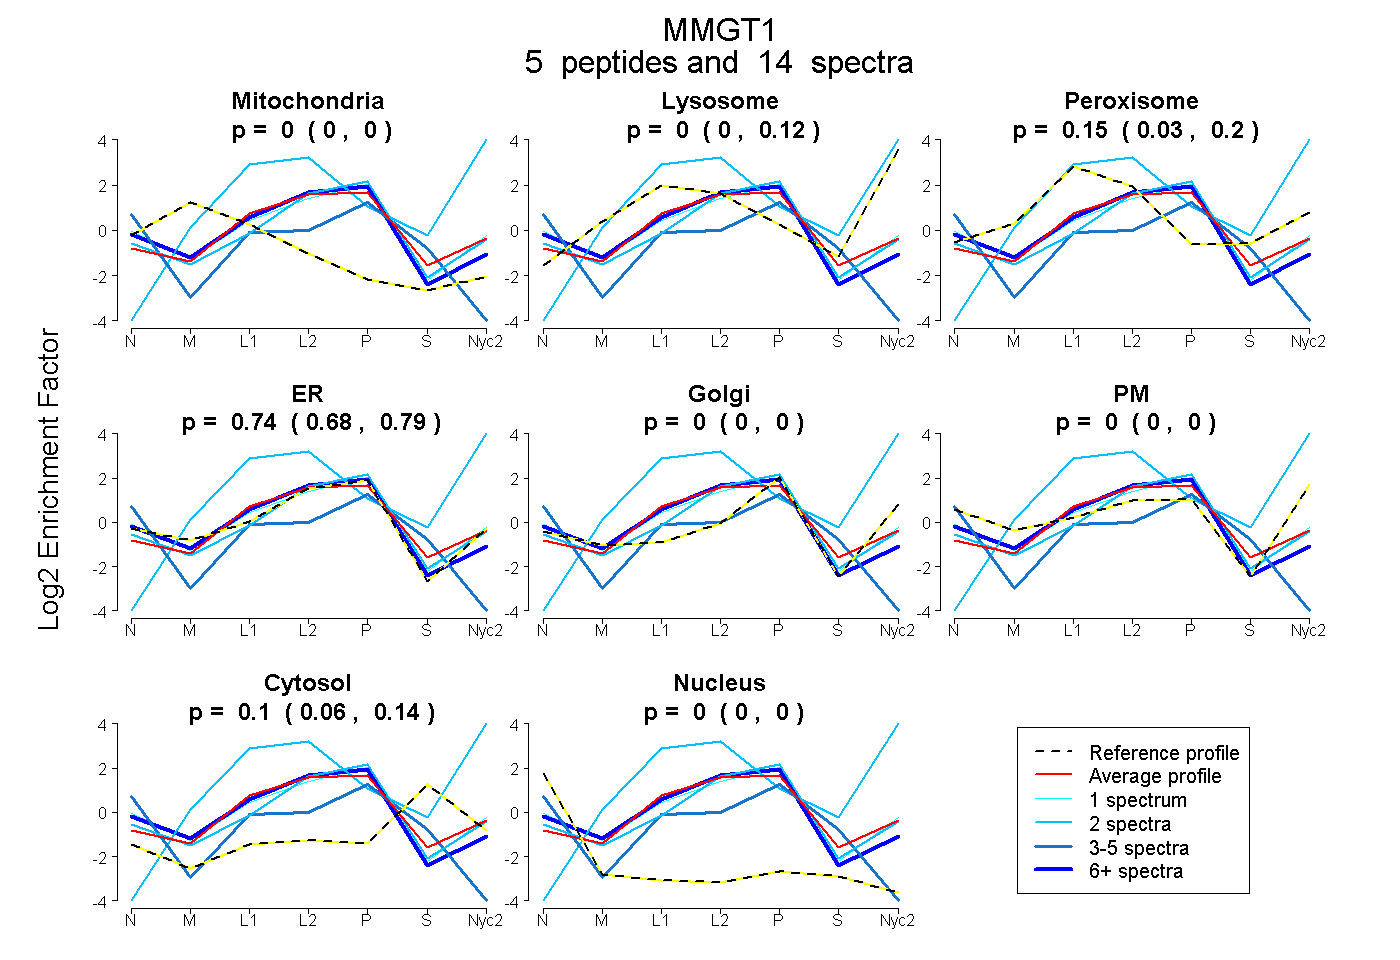
0.000 | 0.000
0.000 | 0.125
0.027 | 0.200
0.676 | 0.787
0.000 | 0.000
0.000 | 0.000
0.059 | 0.144
0.000 | 0.000
1peptide
spectra
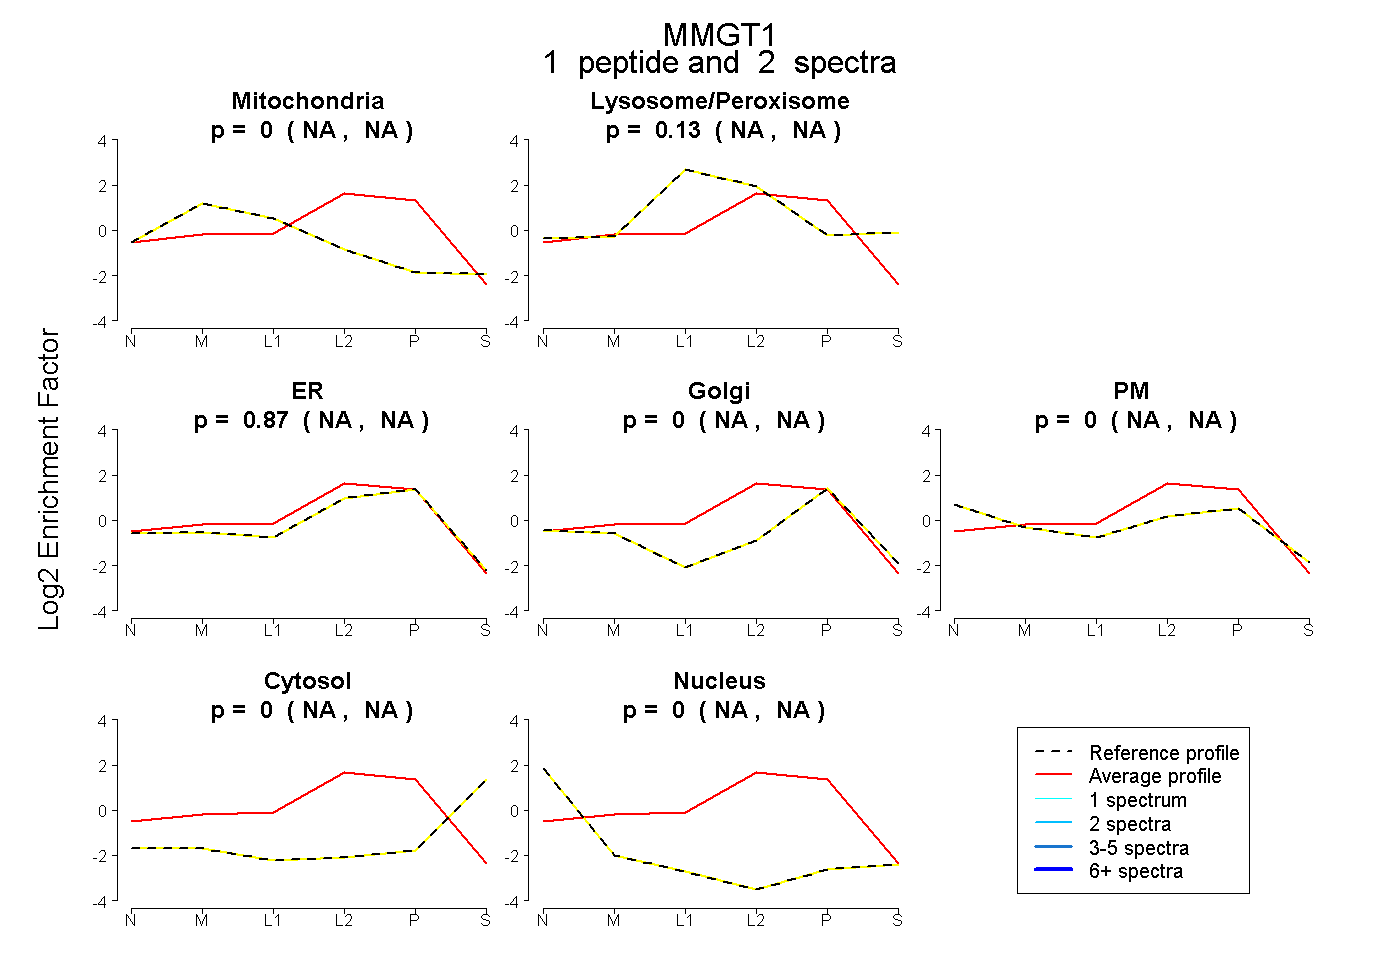
NA | NA
NA | NA
NA | NA
NA | NA
NA | NA
NA | NA
NA | NA
5peptides
spectra
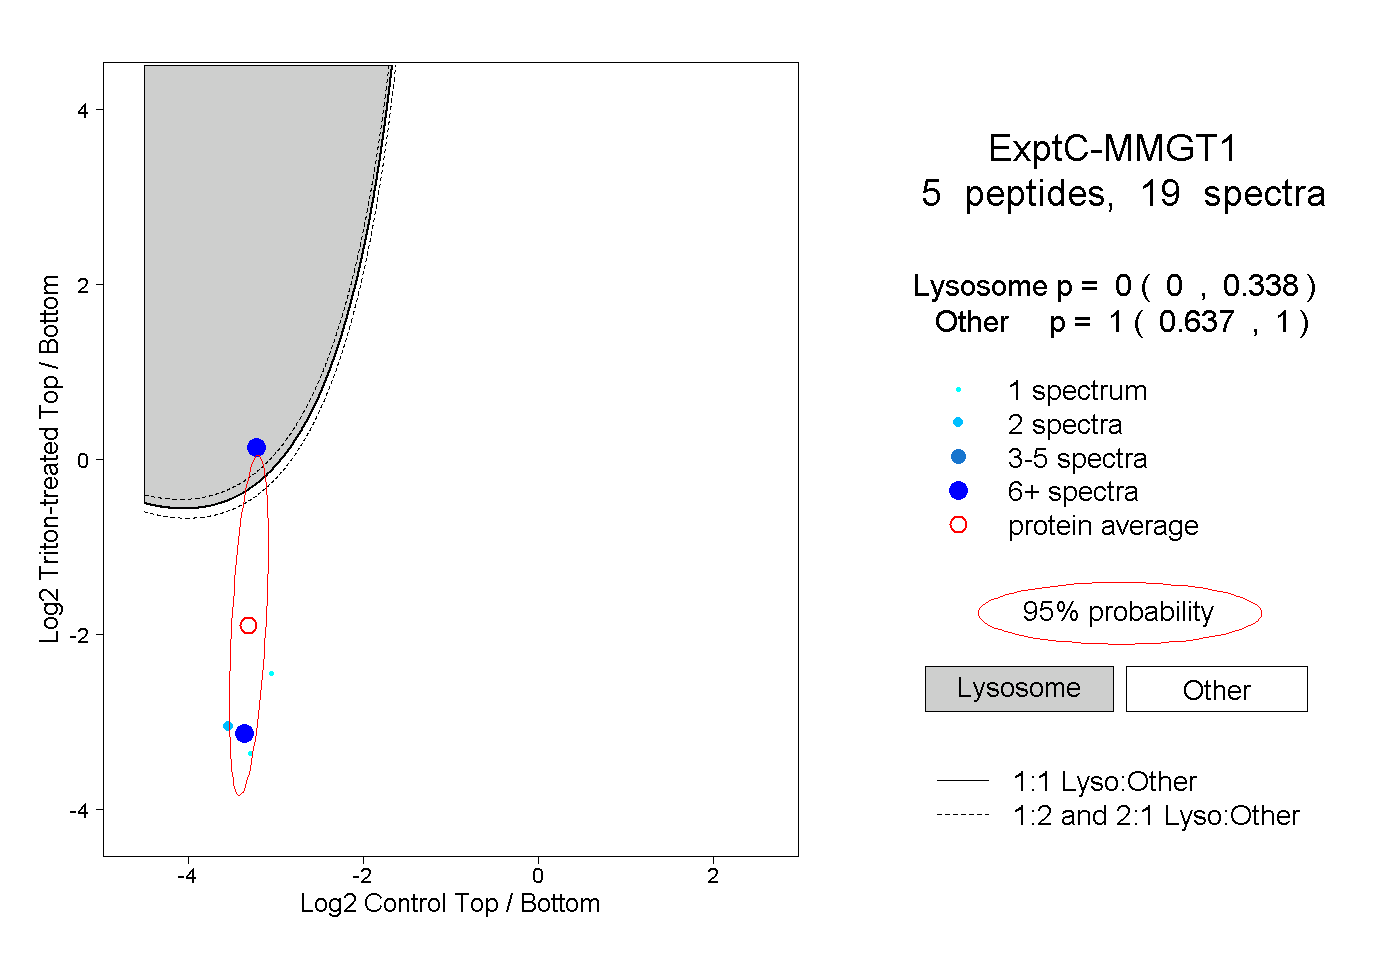
0.000 | 0.338
0.637 | 1.000