 41
41peptides
spectra
0.000 | 0.000
0.000 | 0.000
0.000 | 0.000
0.000 | 0.000
0.000 | 0.000
0.000 | 0.000
0.855 | 0.859
0.140 | 0.144
| Plot | Mito | Lyso | Perox | ER | Golgi | PM | Cytosol | Nucleus | |||||
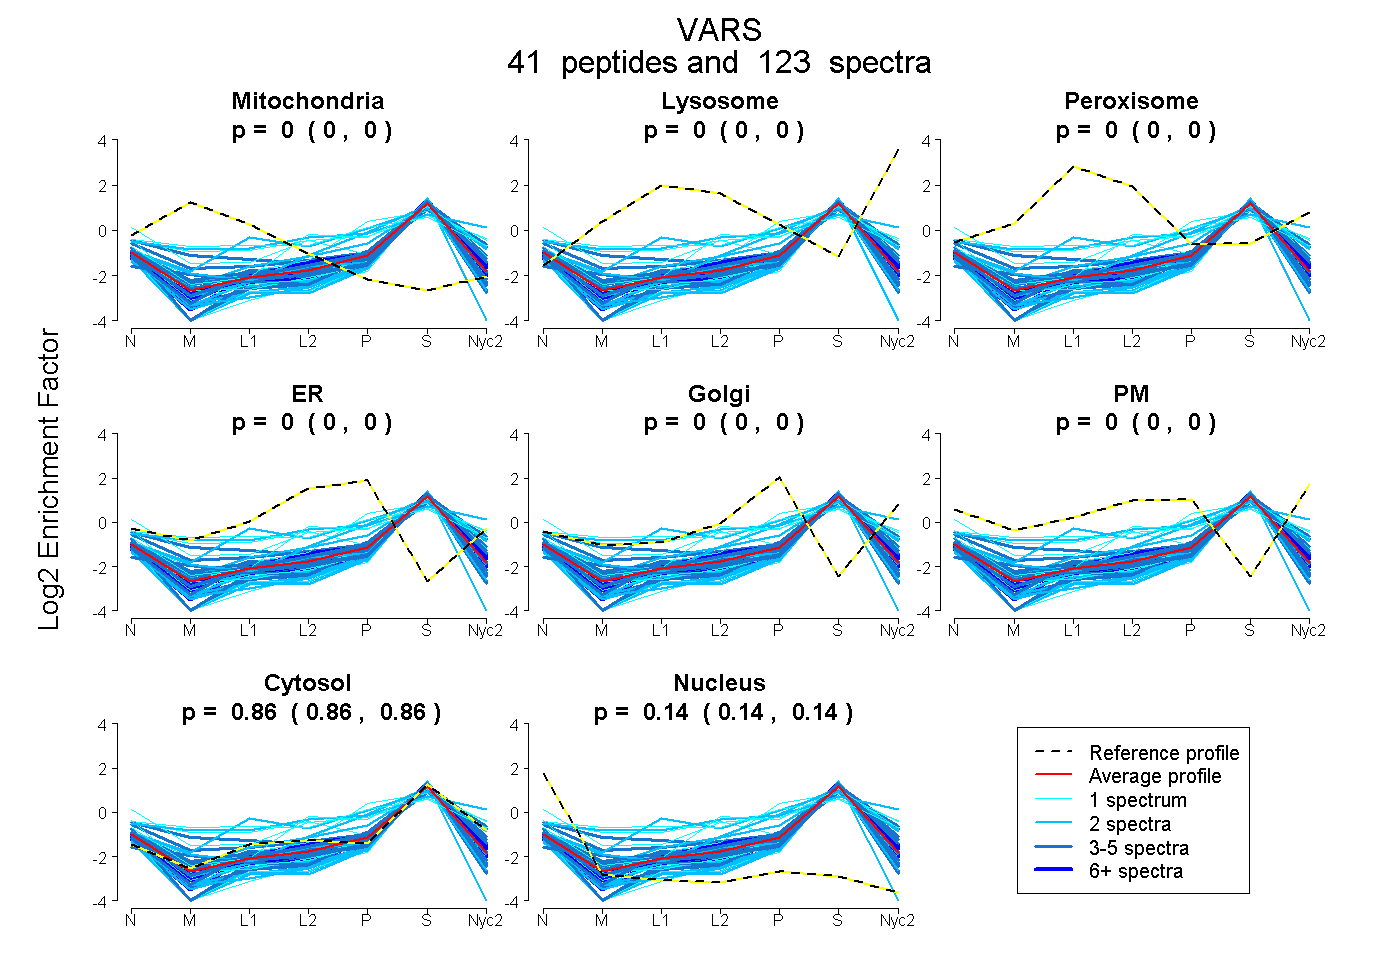
| Expt A |
41 peptides |
123 spectra |
|
0.000 0.000 | 0.000 |
0.000 0.000 | 0.000 |
0.000 0.000 | 0.000 |
0.000 0.000 | 0.000 |
0.000 0.000 | 0.000 |
0.000 0.000 | 0.000 |
0.858 0.855 | 0.859 |
0.142 0.140 | 0.144 |
| 1 spectrum, AVLAALK | 0.000 | 0.000 | 0.000 | 0.000 | 0.000 | 0.000 | 0.837 | 0.163 | ||
| 2 spectra, LAEAVR | 0.000 | 0.000 | 0.000 | 0.066 | 0.000 | 0.000 | 0.833 | 0.101 | ||
| 3 spectra, ACFTMDPK | 0.000 | 0.000 | 0.000 | 0.000 | 0.000 | 0.000 | 0.846 | 0.154 | ||
| 1 spectrum, ADFPAGIPECGTDALR | 0.000 | 0.000 | 0.000 | 0.000 | 0.000 | 0.000 | 0.663 | 0.337 | ||
| 2 spectra, IETMLGDVAVAVHPK | 0.000 | 0.000 | 0.120 | 0.152 | 0.032 | 0.000 | 0.696 | 0.000 | ||
| 4 spectra, QLWWGHR | 0.000 | 0.000 | 0.000 | 0.000 | 0.000 | 0.000 | 0.844 | 0.156 | ||
| 5 spectra, IWGNVTR | 0.000 | 0.000 | 0.000 | 0.000 | 0.024 | 0.000 | 0.883 | 0.093 | ||
| 1 spectrum, SVTQQPGSEITAPQK | 0.000 | 0.000 | 0.000 | 0.000 | 0.000 | 0.312 | 0.649 | 0.039 | ||
| 2 spectra, FGLCAYTSQGR | 0.000 | 0.000 | 0.000 | 0.000 | 0.000 | 0.000 | 0.664 | 0.336 | ||
| 2 spectra, LEAISIMDSK | 0.000 | 0.000 | 0.000 | 0.000 | 0.117 | 0.000 | 0.863 | 0.019 | ||
| 5 spectra, AASGYSAK | 0.000 | 0.000 | 0.000 | 0.000 | 0.037 | 0.000 | 0.928 | 0.035 | ||
| 2 spectra, TQQQQPAHGEK | 0.002 | 0.000 | 0.000 | 0.000 | 0.000 | 0.000 | 0.794 | 0.204 | ||
| 4 spectra, ICLQPPPSSR | 0.000 | 0.000 | 0.000 | 0.000 | 0.000 | 0.000 | 0.809 | 0.191 | ||
| 2 spectra, DVVEPLLRPQWYVR | 0.000 | 0.000 | 0.000 | 0.000 | 0.000 | 0.000 | 0.840 | 0.160 | ||
| 2 spectra, AVLGEVVLYSGAR | 0.000 | 0.000 | 0.000 | 0.000 | 0.000 | 0.000 | 0.743 | 0.257 | ||
| 1 spectrum, LWNATK | 0.000 | 0.000 | 0.000 | 0.000 | 0.000 | 0.000 | 0.825 | 0.175 | ||
| 3 spectra, EAFLQEVWK | 0.000 | 0.000 | 0.000 | 0.000 | 0.000 | 0.000 | 0.887 | 0.113 | ||
| 1 spectrum, YWVSGR | 0.086 | 0.000 | 0.144 | 0.000 | 0.240 | 0.000 | 0.530 | 0.000 | ||
| 4 spectra, VPLEVQEADEVK | 0.000 | 0.000 | 0.000 | 0.000 | 0.000 | 0.000 | 0.845 | 0.155 | ||
| 4 spectra, IPAYFITVHDPAVPPGEDPDGR | 0.000 | 0.000 | 0.000 | 0.000 | 0.000 | 0.000 | 0.831 | 0.169 | ||
| 4 spectra, SILYVSPHPDAFPSLR | 0.000 | 0.000 | 0.000 | 0.000 | 0.000 | 0.000 | 0.807 | 0.193 | ||
| 2 spectra, DNPMVVPLCNR | 0.000 | 0.000 | 0.000 | 0.000 | 0.000 | 0.000 | 0.861 | 0.139 | ||
| 5 spectra, TPFPPPR | 0.000 | 0.000 | 0.000 | 0.000 | 0.000 | 0.000 | 0.910 | 0.090 | ||
| 1 spectrum, CGEMAQAASAAVTR | 0.088 | 0.000 | 0.148 | 0.000 | 0.000 | 0.097 | 0.667 | 0.000 | ||
| 3 spectra, ADYNLTR | 0.019 | 0.000 | 0.000 | 0.000 | 0.000 | 0.117 | 0.819 | 0.045 | ||
| 1 spectrum, QGFFKPEYGRPSVSAPNPR | 0.000 | 0.000 | 0.000 | 0.000 | 0.000 | 0.000 | 0.783 | 0.217 | ||
| 12 spectra, AILAAR | 0.000 | 0.000 | 0.000 | 0.000 | 0.000 | 0.000 | 0.849 | 0.151 | ||
| 6 spectra, ITPAHDQNDYEVGQR | 0.000 | 0.000 | 0.000 | 0.000 | 0.000 | 0.000 | 0.878 | 0.122 | ||
| 4 spectra, MVMLGLK | 0.000 | 0.000 | 0.000 | 0.000 | 0.000 | 0.000 | 0.840 | 0.160 | ||
| 1 spectrum, GPGQDPQAALGALGK | 0.000 | 0.000 | 0.000 | 0.000 | 0.000 | 0.000 | 0.774 | 0.226 | ||
| 1 spectrum, QTLYTCLDVGLR | 0.000 | 0.000 | 0.000 | 0.000 | 0.000 | 0.000 | 0.913 | 0.087 | ||
| 4 spectra, EFGVSPDK | 0.170 | 0.000 | 0.000 | 0.000 | 0.000 | 0.069 | 0.761 | 0.000 | ||
| 5 spectra, ALNPLEEWLR | 0.000 | 0.000 | 0.000 | 0.000 | 0.000 | 0.000 | 0.761 | 0.239 | ||
| 4 spectra, DINLDVNR | 0.000 | 0.000 | 0.000 | 0.000 | 0.000 | 0.000 | 0.725 | 0.275 | ||
| 1 spectrum, YGEAGDGPGWGGPHPR | 0.000 | 0.000 | 0.000 | 0.156 | 0.033 | 0.000 | 0.811 | 0.000 | ||
| 5 spectra, WFNTCVR | 0.000 | 0.000 | 0.000 | 0.000 | 0.013 | 0.000 | 0.893 | 0.095 | ||
| 2 spectra, SVVHPFLSR | 0.000 | 0.020 | 0.098 | 0.000 | 0.016 | 0.265 | 0.601 | 0.000 | ||
| 2 spectra, LQQTEAELR | 0.000 | 0.000 | 0.000 | 0.000 | 0.000 | 0.000 | 0.785 | 0.215 | ||
| 2 spectra, DWCISR | 0.000 | 0.000 | 0.000 | 0.000 | 0.000 | 0.000 | 0.689 | 0.311 | ||
| 6 spectra, EVYLHAIVR | 0.000 | 0.000 | 0.000 | 0.000 | 0.000 | 0.000 | 0.889 | 0.111 | ||
| 1 spectrum, ILPEAHQR | 0.000 | 0.000 | 0.000 | 0.142 | 0.009 | 0.000 | 0.703 | 0.146 |
| Plot | Mito | Lyso or Perox | ER | Golgi | PM | Cytosol | Nucleus | ||||||
| Expt B |
19 peptides |
36 spectra |
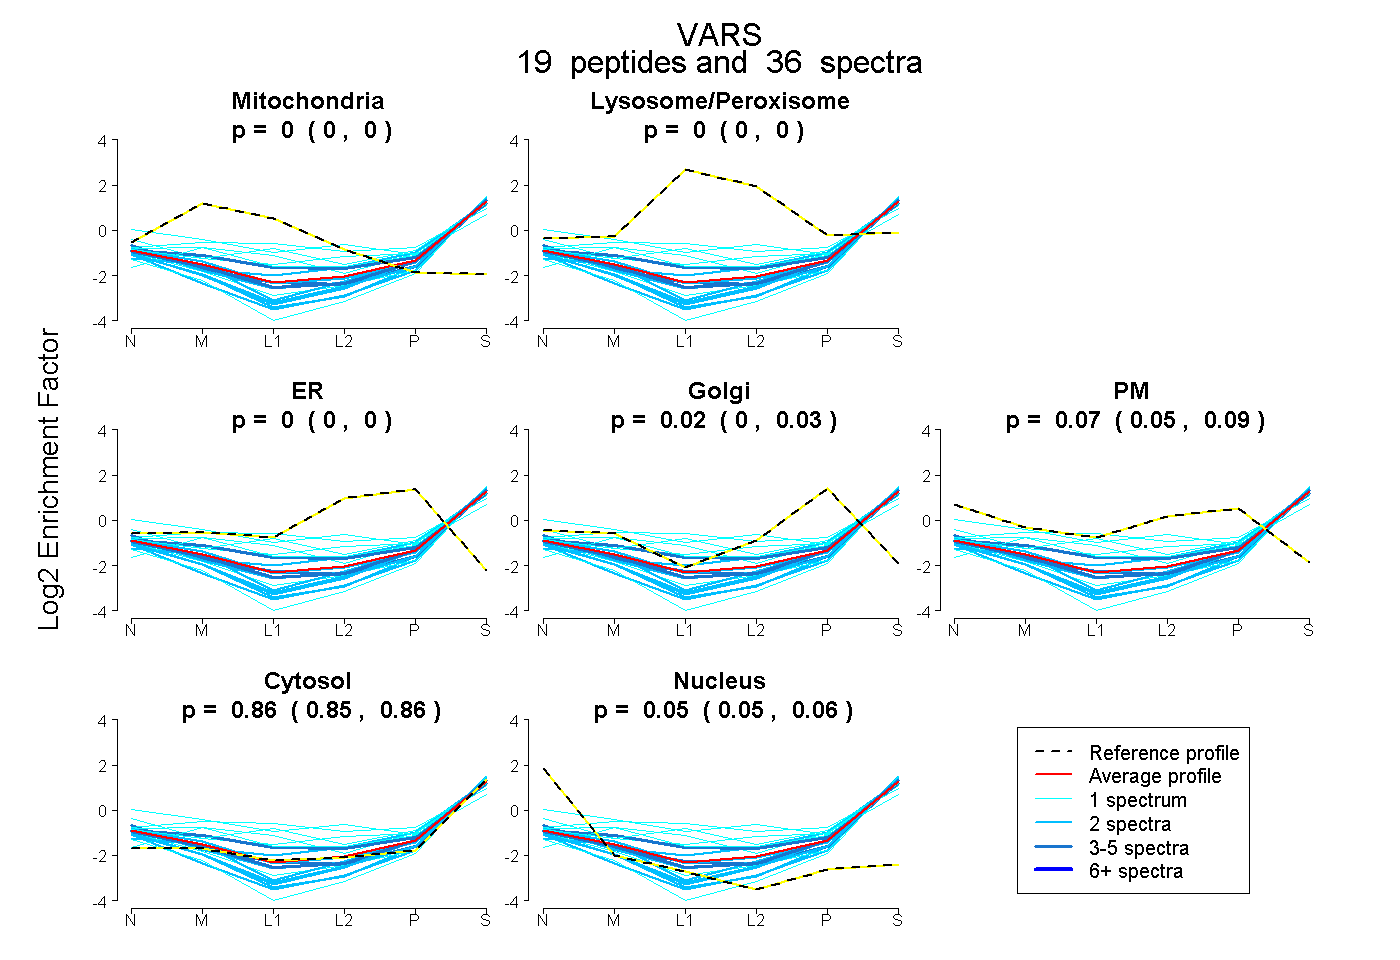 |
0.000 0.000 | 0.000 |
0.000 0.000 | 0.000 |
0.000 0.000 | 0.000 |
0.017 0.000 | 0.034 |
0.073 0.048 | 0.092 |
0.857 0.852 | 0.860 |
0.054 0.047 | 0.060 |
|||
| Plot | Lyso | Other | |||||||||||
| Expt C |
32 peptides |
74 spectra |
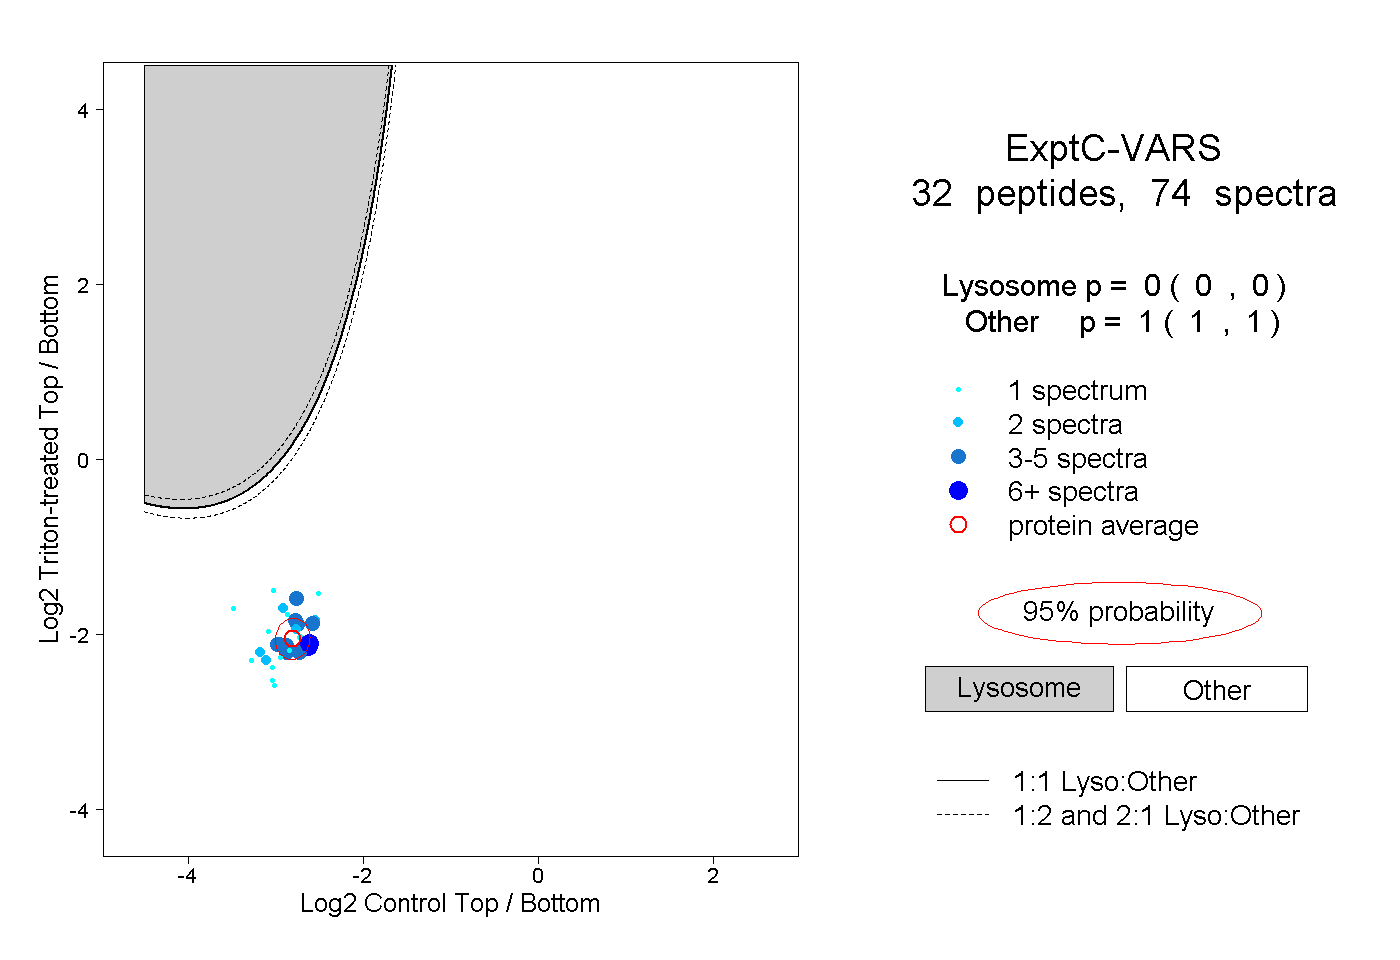 |
0.000 0.000 | 0.000 |
1.000 1.000 | 1.000 |
||||||||
| Plot | Lyso | Other | |||||||||||
| Expt D |
5 peptides |
15 spectra |
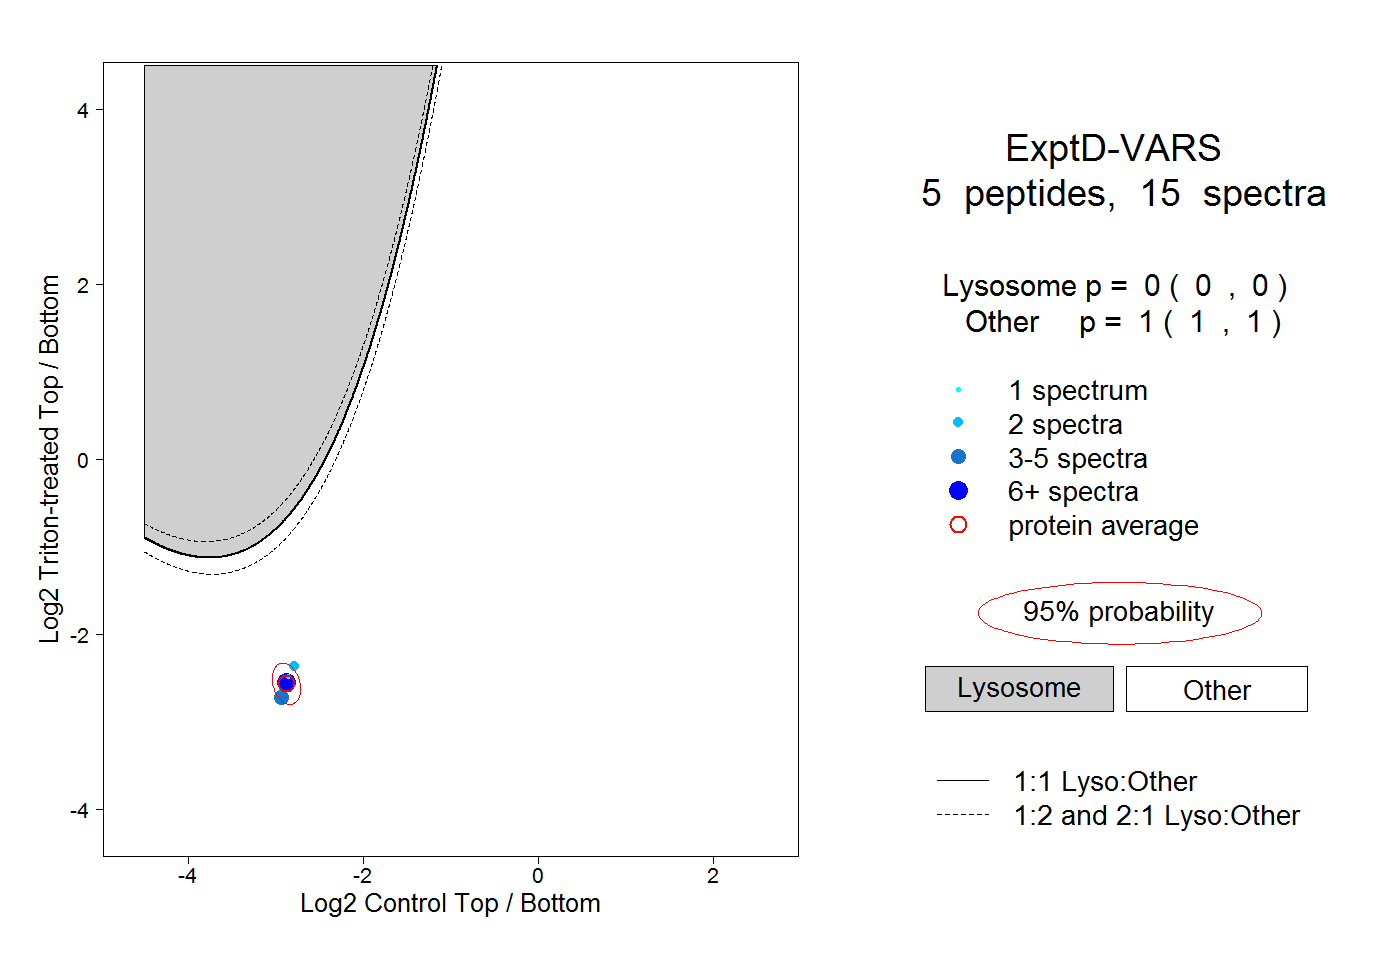 |
0.000 0.000 | 0.000 |
1.000 1.000 | 1.000 |